Lebanon: Fire Incidents, Ohio (OH)
Where are fire incidents reported in Lebanon, OH
Something went wrong! Please refresh the page.
|
| |||||||||||||||||||||||||||||||||||||||||||||||||||||||||||||||||||||||||||||||||||||||||||||||||||||||||||||
2002 - 2018 National Fire Incident Reporting System (NFIRS) incidents
- Incident types reported to NFIRS in Lebanon, OH
- 6,86173.1%Rescue & EMS
- 6717.1%Service Call
- 5315.7%False Alarm
- 5075.4%Good Intent Call
- 4925.2%Fire
- 3053.2%Hazardous Condition
- Fire incident types reported to NFIRS in Lebanon, OH
- 38678.5%Structure Fires
- 6513.2%Outside Fires
- 397.9%Mobile Property/Vehicle Fires
- 20.4%Other
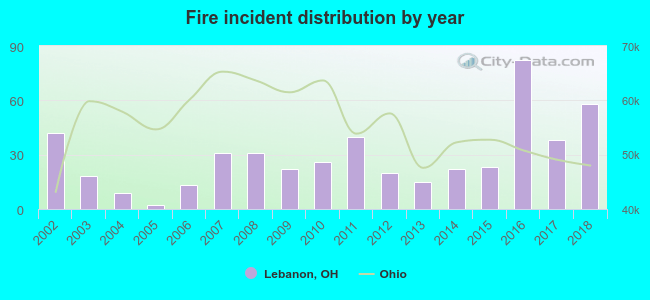 Based on the data from the years 2002 - 2018 the average number of fire incidents per year is 29. The highest number of reported fires - 82 took place in 2016, and the least - 2 in 2005. The data has an increasing trend.
The average number of yearly fire incidents per 10k residents in Lebanon, OH compared to nearest cities:
(Note: Based on data for the last 3 years, including only cities with population 5,000 and above)
| Lebanon: | 29.0 |
| Mason: | 33.1 |
| Monroe: | 33.4 |
| Springboro: | 20.9 |
| Middletown: | 44.0 |
| Franklin: | 54.2 |
| Loveland: | 55.1 |
| Carlisle: | 41.7 |
| Trenton: | 34.0 |
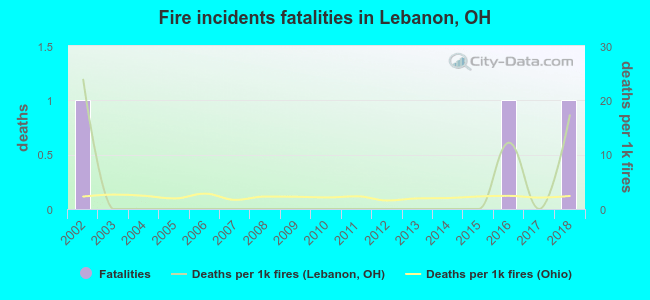 According to the reports from the years 2002 - 2018 the average number of fire-related yearly deaths is 0. The highest number of deaths - 1 took place in 2002, and the lowest - 0 in 2003. The data has a constant trend.
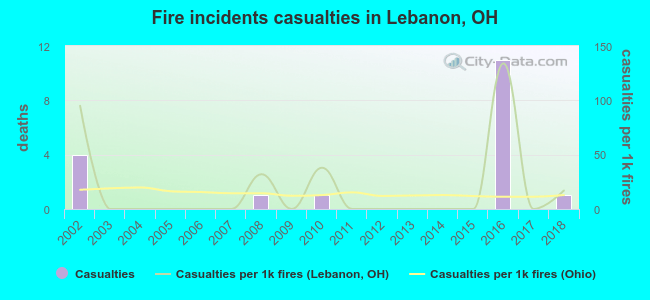 Based on the data from the years 2002 - 2018 the average number of fire-related yearly casualties is 1. The highest number of reported injuries - 11 took place in 2016, and the lowest - 0 in 2003. The data has a dropping trend.
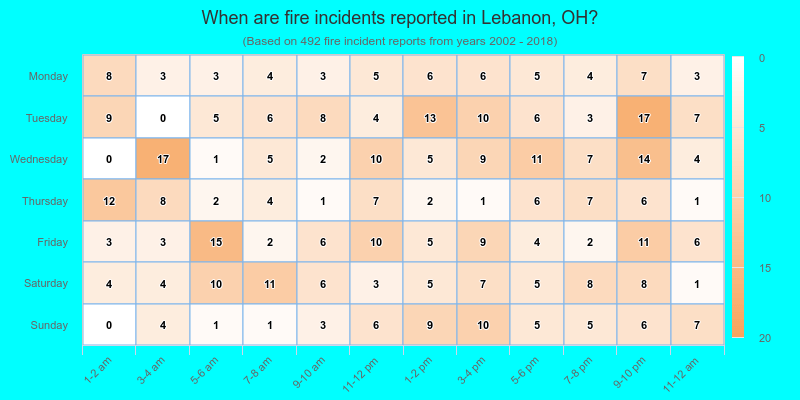
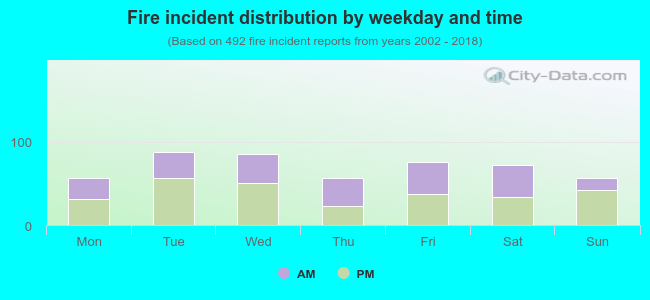 44.5% incidents where reported in the morning and 55.5% in the evening. The most fires (17.9%) took place on Tuesday, and the least (11.6%) on Monday.
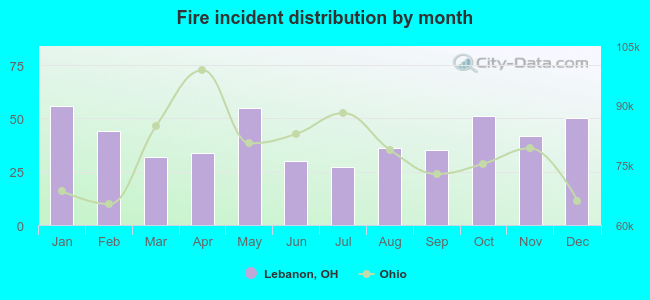 Based on the 492 reports from years 2002 - 2018 most fires (11.4%) took place during January, and the least (5.5%) in July.
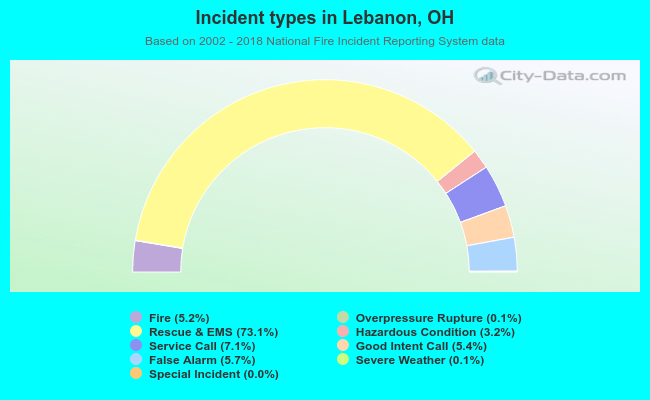 Out of all 9,386 cases reported during the years 2002 - 2018, the most belonged to the categories: Rescue & EMS (73.1%), Service Call (7.1%), and False Alarm (5.7%).
 When looking into fire subcategories, the most reports belonged to: Structure Fires (78.5%), and Outside Fires (13.2%).