Lincoln: Fire Incidents, Nebraska (NE)
Where are fire incidents reported in Lincoln, NE
Something went wrong! Please refresh the page.
| Fire incidents reported | |
|---|---|
| Sreet name | Count |
| O ST | 270 |
| 27TH ST | 250 |
| 48TH ST | 196 |
| CORNHUSKER HWY | 158 |
| A ST | 134 |
| D ST | 118 |
| 14TH ST | 116 |
| 70TH ST | 112 |
| 12TH ST | 110 |
| Q ST | 104 |
| J ST | 96 |
| 9TH ST | 94 |
| E ST | 94 |
| 17TH ST | 86 |
| 16TH ST | 84 |
| 20TH ST | 82 |
| ADAMS ST | 82 |
| 56TH ST | 80 |
| G ST | 80 |
| 27TH ST | 78 |
| F ST | 78 |
| 25TH ST | 76 |
| 44TH ST | 76 |
| 1ST ST | 74 |
| 26TH ST | 70 |
| 11TH ST | 68 |
| FLETCHER AVE | 68 |
| HUNTINGTON AVE | 68 |
| 40TH ST | 66 |
| HOLDREGE ST | 64 |
| Other | 2,766 |
2002 - 2018 National Fire Incident Reporting System (NFIRS) incidents
- Incident types reported to NFIRS in Lincoln, NE
- 6,66825.4%Hazardous Condition
- 5,89822.4%Fire
- 4,88318.6%False Alarm
- 4,09215.6%Good Intent Call
- 2,3148.8%Service Call
- 1,3004.9%Rescue & EMS
- 7392.8%Special Incident
- 3301.3%Overpressure Rupture
- 550.2%Severe Weather
- Fire incident types reported to NFIRS in Lincoln, NE
- 2,67245.3%Structure Fires
- 2,07335.1%Outside Fires
- 1,11718.9%Mobile Property/Vehicle Fires
- 360.6%Other
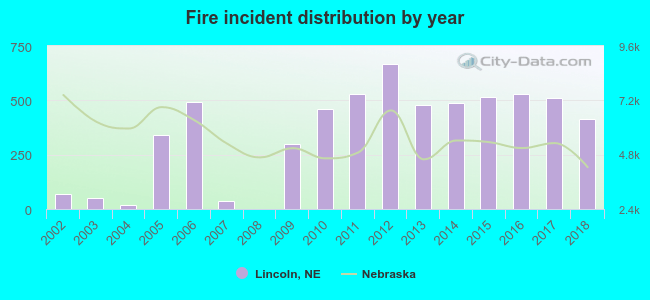 According to the data from the years 2002 - 2018 the average number of fires per year is 347. The highest number of fires - 666 took place in 2012, and the least - 2 in 2008. The data has an increasing trend.
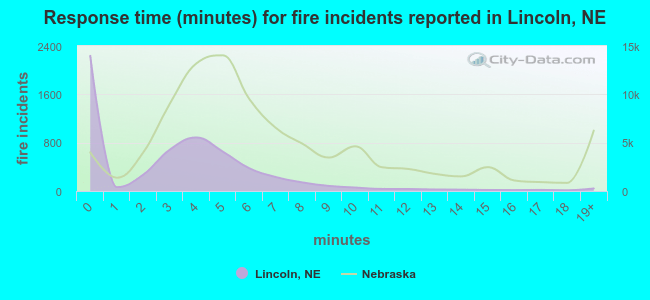 The median response time based on all reported fire incidents is 3 minutes. This is much lower compared to the state median value.
The median response time in Lincoln, NE compared to nearest cities:
(Note: Based on data for all years, including only cities with at least 500 fire incidents)
| Lincoln: | 3 minutes |
| Ashland: | 8 minutes |
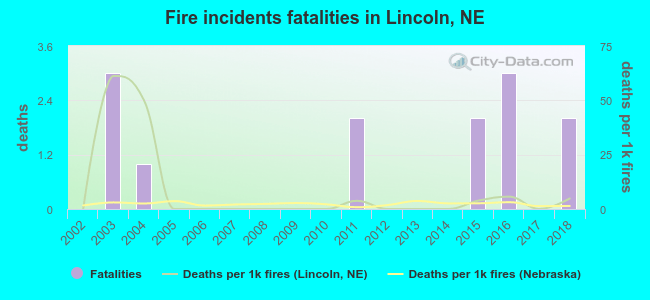 According to the reports from the years 2002 - 2018 the average number of fire-related yearly deaths is 1. The highest number of reported deaths - 3 took place in 2003, and the lowest - 0 in 2002. The data has an increasing trend.
The average number of deaths per 1,000 fires is 8. This indicator was the highest - 61 in 2003, and the lowest 0 in 2002. The trend for fatalities per 1,000 incidents is rising. Compared to the state value the number of fatalities per 1,000 fires is similar.
According to the reports from the years 2002 - 2018 the average number of fire-related yearly deaths is 1. The highest number of reported deaths - 3 took place in 2003, and the lowest - 0 in 2002. The data has an increasing trend.
The average number of deaths per 1,000 fires is 8. This indicator was the highest - 61 in 2003, and the lowest 0 in 2002. The trend for fatalities per 1,000 incidents is rising. Compared to the state value the number of fatalities per 1,000 fires is similar.Deaths per 1,000 incidents in Lincoln, NE compared to nearest cities:
(Note: Based on data for all years, including only cities with at least 2,500 fire incidents)
| Lincoln: | 2.2 |
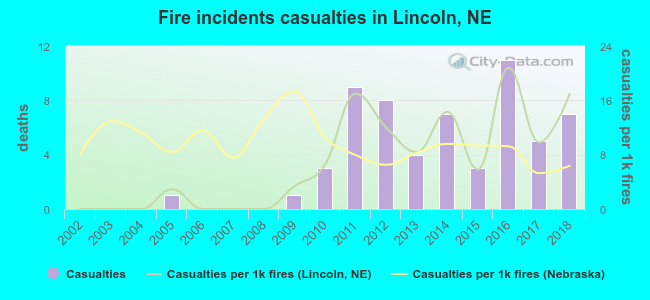 According to the reports from the years 2002 - 2018 the average number of fire-related yearly casualties is 3. The highest number of reported injuries - 11 took place in 2016, and the lowest - 0 in 2002. The data has a rising trend.
The average number of casualties per 1,000 fire incidents is 7. This indicator was the highest - 21 in 2016, and the lowest 0 in 2002. The trend for injuries per 1,000 incidents is growing. Compared to the Nebraska value the number of casualties per 1,000 incidents is about the same.
According to the reports from the years 2002 - 2018 the average number of fire-related yearly casualties is 3. The highest number of reported injuries - 11 took place in 2016, and the lowest - 0 in 2002. The data has a rising trend.
The average number of casualties per 1,000 fire incidents is 7. This indicator was the highest - 21 in 2016, and the lowest 0 in 2002. The trend for injuries per 1,000 incidents is growing. Compared to the Nebraska value the number of casualties per 1,000 incidents is about the same.Casualties per 1,000 incidents in Lincoln, NE compared to nearest cities:
(Note: Based on data for all years, including only cities with at least 500 fire incidents)
| Lincoln: | 10.0 |
| Ashland: | 0.0 |
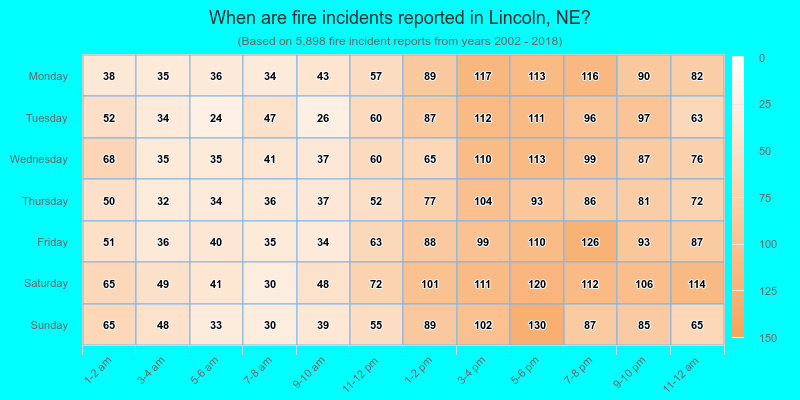
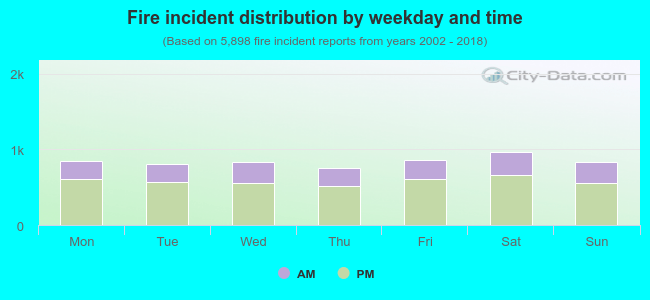 31.1% incidents where reported in the morning and 68.9% in the evening. The most fires (16.4%) took place on Saturday, and the least (12.8%) on Thursday.
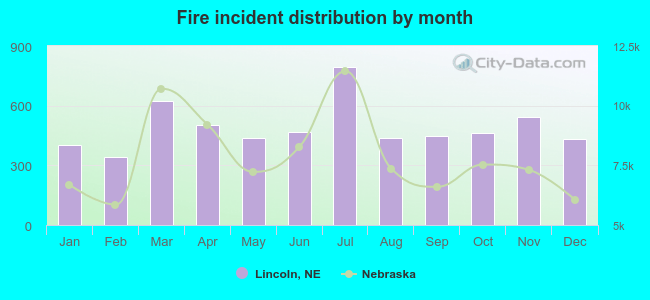 Based on the 5,898 fire incidents from years 2002 - 2018 most fires (13.5%) took place during July, and the least (5.8%) in February.
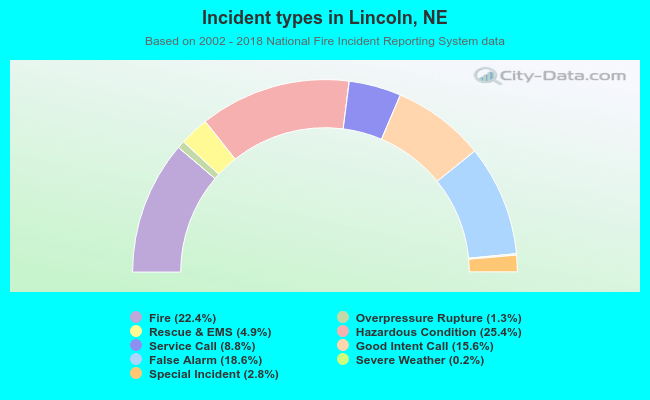 Out of all 26,279 cases reported during the years 2002 - 2018, the most belonged to the categories: Hazardous Condition (25.4%), Fire (22.4%), and False Alarm (18.6%).
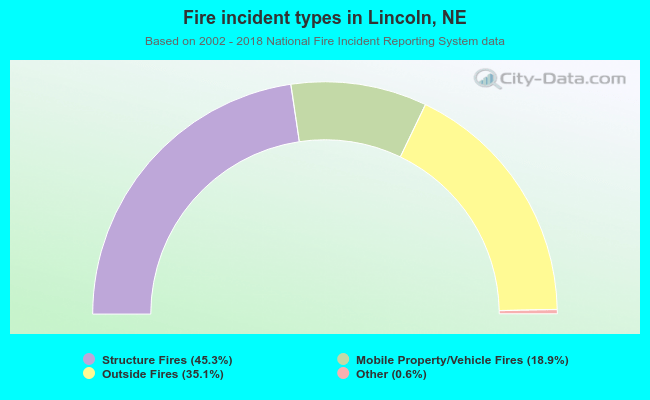 When looking into fire subcategories, the most incidents belonged to: Structure Fires (45.3%), and Outside Fires (35.1%).