Logansport: Fire Incidents, Indiana (IN)
Where are fire incidents reported in Logansport, IN
Something went wrong! Please refresh the page.
| Fire incidents reported | |
|---|---|
| Sreet name | Count |
| MARKET ST | 150 |
| BROADWAY | 70 |
| HIGH ST | 66 |
| SPEAR ST | 56 |
| GEORGE ST | 52 |
| NORTH ST | 50 |
| LINDEN AVE | 46 |
| US 35 | 40 |
| WHEATLAND AVE | 36 |
| 3RD ST | 34 |
| CR 300 | 32 |
| MAIN ST | 32 |
| MIAMI AVE | 32 |
| MICHIGAN AVE | 30 |
| BATES ST | 28 |
| ERIE AVE | 28 |
| SMITH ST | 28 |
| BURLINGTON AVE | 26 |
| SR 25 | 24 |
| 17TH ST | 22 |
| 18TH ST | 22 |
| CR 450 | 22 |
| CR 50 | 22 |
| OTTAWA ST | 22 |
| 10TH ST | 20 |
| 15TH ST | 20 |
| 20TH ST | 18 |
| CLIFF DR | 18 |
| CR 150 | 18 |
| HELM ST | 18 |
| Other | 676 |
2002 - 2017 National Fire Incident Reporting System (NFIRS) incidents
- Incident types reported to NFIRS in Logansport, IN
- 2,29237.7%Rescue & EMS
- 1,75829.0%Fire
- 96415.9%Hazardous Condition
- 5038.3%Good Intent Call
- 2604.3%False Alarm
- 2484.1%Service Call
- 240.4%Special Incident
- 130.2%Overpressure Rupture
- 100.2%Severe Weather
- Fire incident types reported to NFIRS in Logansport, IN
- 64636.7%Outside Fires
- 50128.5%Structure Fires
- 36921.0%Other
- 24213.8%Mobile Property/Vehicle Fires
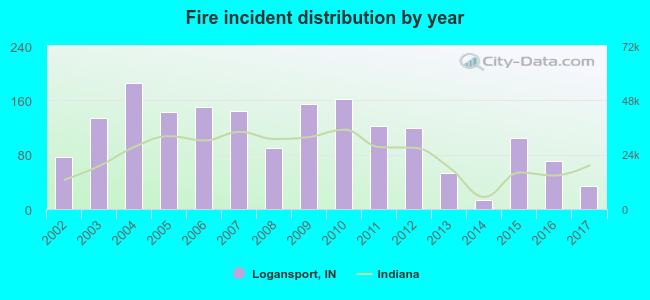 Based on the data from the years 2002 - 2017 the average number of fire incidents per year is 110. The highest number of reported fires - 186 took place in 2004, and the least - 13 in 2014. The data has a dropping trend.
The average number of yearly fire incidents per 10k residents in Logansport, IN compared to nearest cities:
(Note: Based on data for the last 3 years, including only cities with population 5,000 and above)
| Logansport: | 29.1 |
| Peru: | 4.5 |
| Monticello: | 20.6 |
| Kokomo: | 21.9 |
| Rochester: | 82.8 |
| Wabash: | 40.9 |
| Frankfort: | 19.8 |
| North Manchester: | 45.1 |
| Lafayette: | 13.1 |
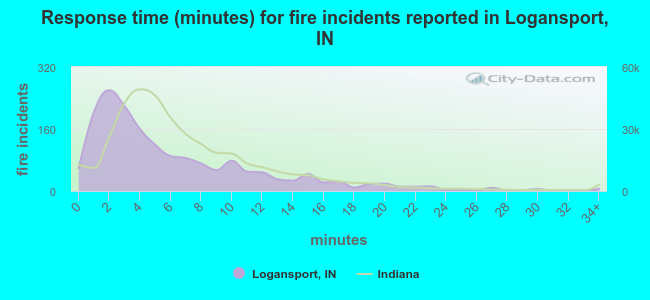 The median response time based on all reported fire incidents is 4 minutes. This is lower than the state median value.
The median response time in Logansport, IN compared to nearest cities:
(Note: Based on data for all years, including only cities with at least 500 fire incidents)
| Logansport: | 4 minutes |
| Peru: | 5 minutes |
| Delphi: | 9 minutes |
| Monticello: | 7 minutes |
| Kokomo: | 5 minutes |
| Rochester: | 8 minutes |
| Winamac: | 9 minutes |
| Wabash: | 5 minutes |
| Greentown: | 10 minutes |
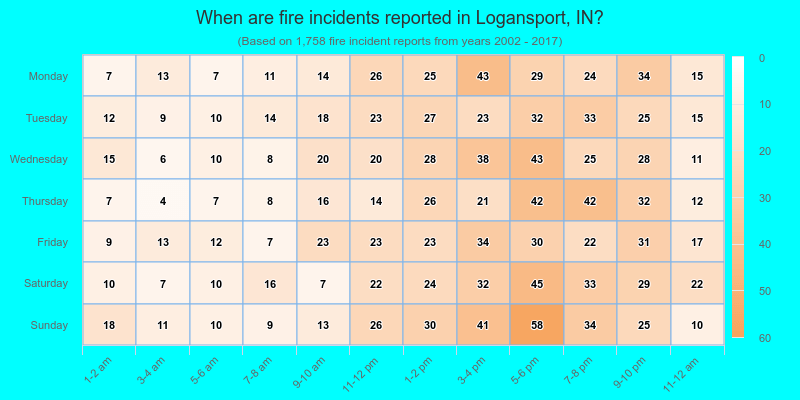
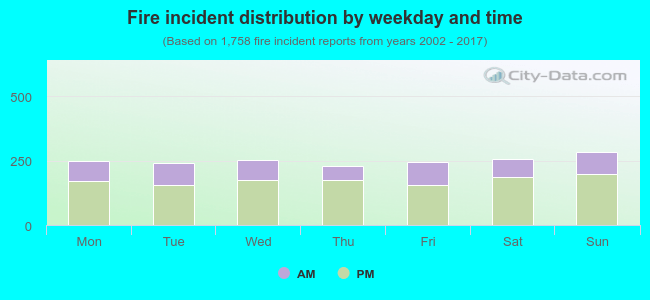 31.0% incidents where reported in the morning and 69.0% in the evening. The most fires (16.2%) took place on Sunday, and the least (13.1%) on Thursday.
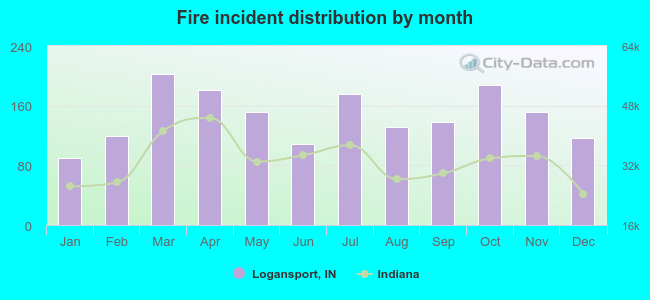 Based on the 1,758 fire incident reports from years 2002 - 2017 most fires (11.5%) took place during March, and the least (5.1%) in January.
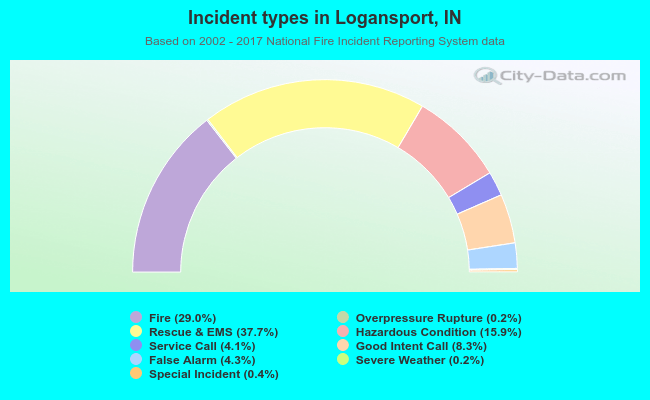 Out of all 6,072 cases reported during the years 2002 - 2017, the most belonged to the categories: Rescue & EMS (37.7%), Fire (29.0%), and Hazardous Condition (15.9%).
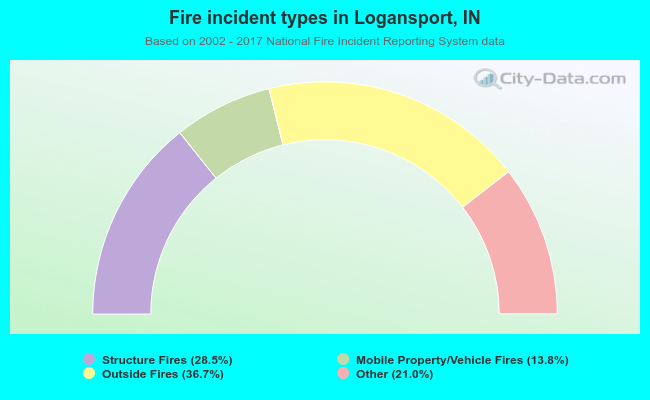 When looking into fire subcategories, the most incidents belonged to: Outside Fires (36.7%), and Structure Fires (28.5%).