| Fire incidents reported |
|---|
| Sreet name | Count |
|---|
| I-10 HWY | 56 | | I10 HWY | 30 | | INTERSTATE 10 | 22 | | I10 | 18 | | INTERSTATE 10 HWY | 16 | | 70 HWY | 14 | | I-10 | 12 | | MOTEL DR | 12 | | 90 HWY | 8 | | ANIMAS STREET | 8 | | 414 W RAILWAY ST | 6 | | 9TH ST | 6 | | ANIMAS ST | 6 | | HIGHWAY 70 | 6 | | 2ND ST | 4 | | 428 WEST GALE STREET | 4 | | 464 HWY | 4 | | 502 W 2ND ST | 4 | | 600 WEST 2ND STREET | 4 | | 900 WEST MOTEL DRIVE | 4 | | CACTUS CHOLLA ST | 4 | | CHOLLA ANIMAS ST | 4 | | CHOLLA STREET | 4 | | FR1007 | 4 | | HIGHWAY 338 HWY | 4 |
| | | Fire incidents reported |
|---|
| Sreet name | Count |
|---|
| HIGHWAY 90 | 4 | | HIGHWAY 90 HWY | 4 | | I 10 AND MM 42 | 4 | | I10 33MM | 4 | | I10 EAST 33MM | 4 | | OCOTILLO STREET | 4 | | ROAD FORKS HWY | 4 | | SEPAR RD | 4 | | SHORT PARK | 4 | | HWY | 2 | | 1 MILE SOUTH OF ANIMAS ST ST | 2 | | 10 | 2 | | 100 COLLINS DRIVE ST | 2 | | 100 EAST MAPLE ST | 2 | | 1000 BIRCHFIELD | 2 | | 1000 BIRCHFIELD ST | 2 | | 1000 COLLINS DR | 2 | | 1000 MAIN ST | 2 | | 1001 COLLINS DRIVE | 2 | | 1006 S ANIMAS STREET ST | 2 | | 1007 MAPLE ST | 2 | | 10TH ST | 2 | | 10TH STREET AND RANDALL STREET | 2 | | 11 OLD HWY 70 | 2 | | 113 HWY | 2 |
|
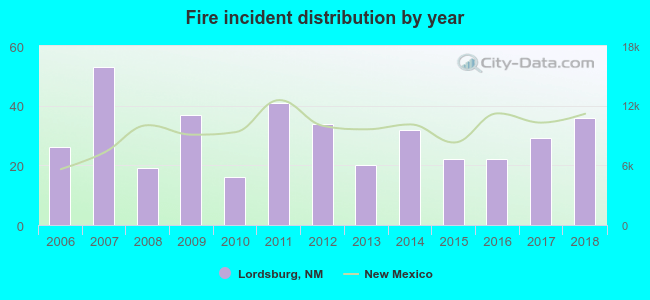 According to the data from the years 2006 - 2018 the average number of fire incidents per year is 30. The highest number of reported fire incidents - 53 took place in 2007, and the least - 16 in 2010. The data has a growing trend.
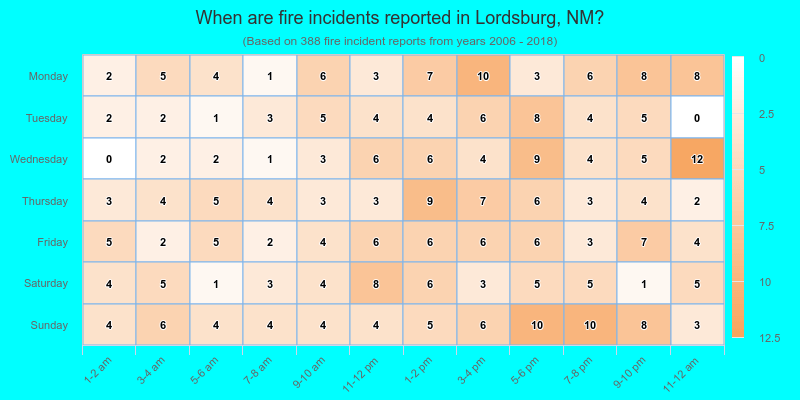
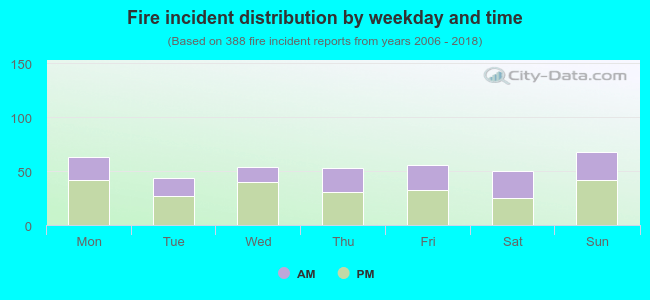 38.4% incidents where reported in the morning and 61.6% in the evening. The most fires (17.5%) took place on Sunday, and the least (11.3%) on Tuesday.
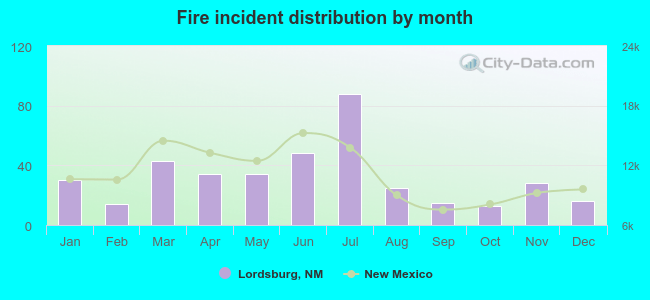 According to the 388 incident reports from years 2006 - 2018 most fires (22.7%) took place during July, and the least (3.4%) in October.
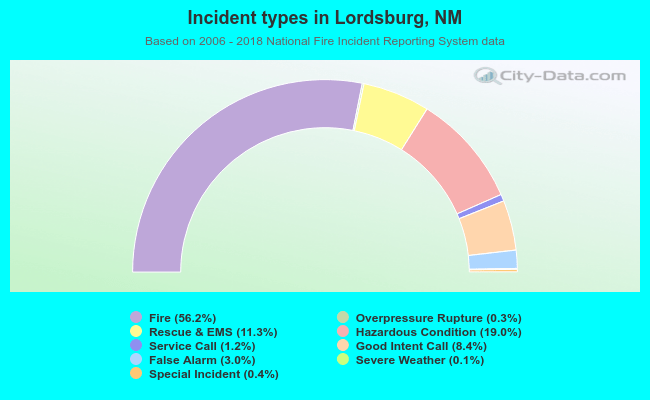 Out of all 690 cases reported during the years 2006 - 2018, the most belonged to the categories: Fire (56.2%), Hazardous Condition (19.0%), and Rescue & EMS (11.3%).
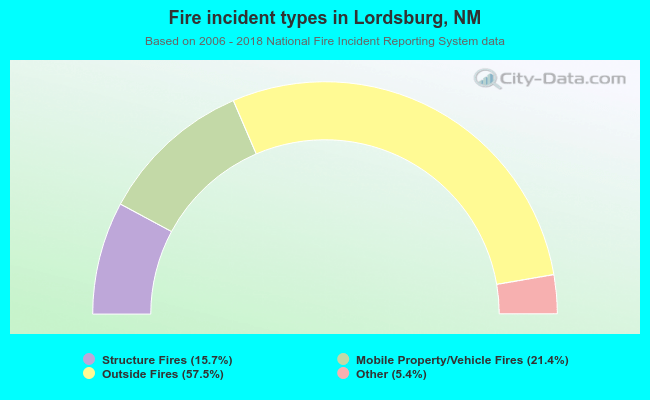 When looking into fire subcategories, the most incidents belonged to: Outside Fires (57.5%), and Mobile Property/Vehicle Fires (21.4%).