| Fire incidents reported |
|---|
| Sreet name | Count |
|---|
| HAMBURG RD | 48 | | JOSHUATOWN RD | 30 | | FERRY RD | 26 | | GRASSY HILL RD | 20 | | BRUSH HILL RD | 18 | | ELYS FERRY RD | 18 | | BEAVERBROOK RD | 16 | | BLOOD ST | 16 | | STERLING CITY RD | 14 | | TOWN ST | 10 | | BILL HILL RD | 8 | | GUNGY RD | 8 | | HONEY HILL RD | 8 | | HOPYARD RD | 8 | | ROUTE 156 | 8 | | BEAVER BROOK RD | 6 | | BIRCH MILL RD | 6 | | NORWICH-SALEM RD | 6 | | NORWICHSALEM RD | 6 | | SELDEN RD | 6 | | BEAVER BROOK RD | 4 | | BECKETT HILL RD | 4 | | DAY HILL RD | 4 | | JOSHUA LN | 4 | | OLD HAMBURG RD | 4 |
| | | Fire incidents reported |
|---|
| Sreet name | Count |
|---|
| SHORE RD | 4 | | STERLING CITY ROAD | 4 | | TATER HILL RD | 4 | | TOWN WOODS RDS | 4 | | WEST RD | 4 | | BAKER LANE | 2 | | BASHAN RD | 2 | | BEAVER BROOK | 2 | | BEAVERBROOK | 2 | | BRUSH HILL RD | 2 | | BURR RD | 2 | | CLARK RD | 2 | | COVE RD | 2 | | EAST HADDAM FIRE DEPT | 2 | | EAST HADDAM RD | 2 | | ELY'S FERRY RD | 2 | | ELYS FERRY ROAD | 2 | | FERRY RD | 2 | | GUNGY RD | 2 | | HAMBURG RD | 2 | | HAMBURG STATION | 2 | | HARTFORD AVE | 2 | | HARTFORD RD | 2 | | INGHAM HILL RD | 2 | | |
|
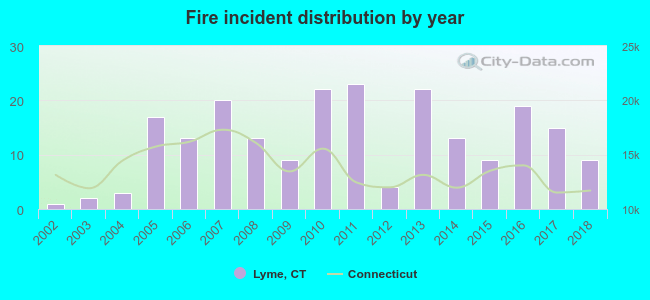 According to the data from the years 2002 - 2018 the average number of fires per year is 13. The highest number of reported fire incidents - 23 took place in 2011, and the least - 1 in 2002. The data has a growing trend.
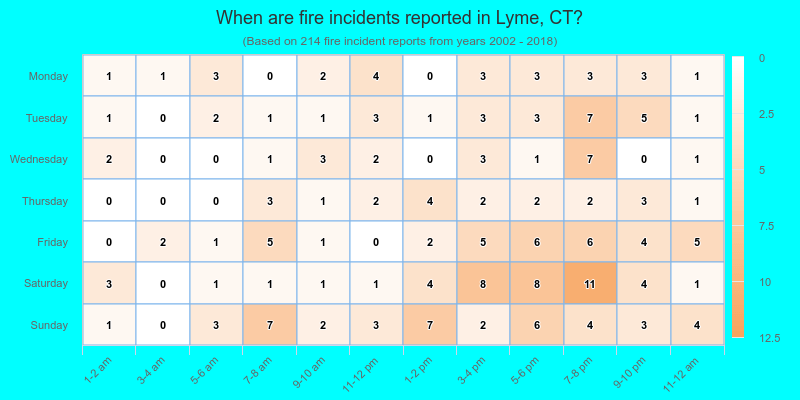
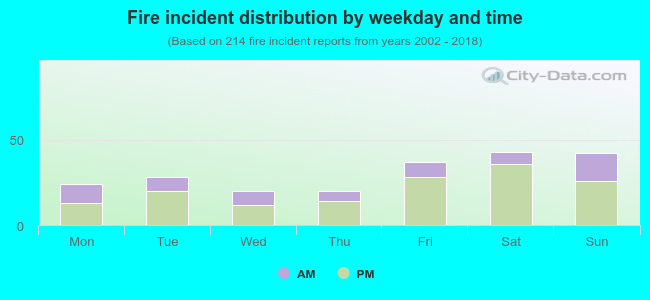 30.4% incidents where reported in the morning and 69.6% in the evening. The most fires (20.1%) took place on Saturday, and the least (9.3%) on Wednesday.
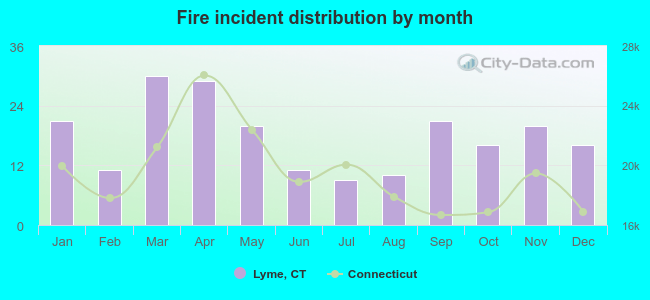 Based on the 214 fire incident reports from years 2002 - 2018 most fires (14.0%) took place during March, and the least (4.2%) in July.
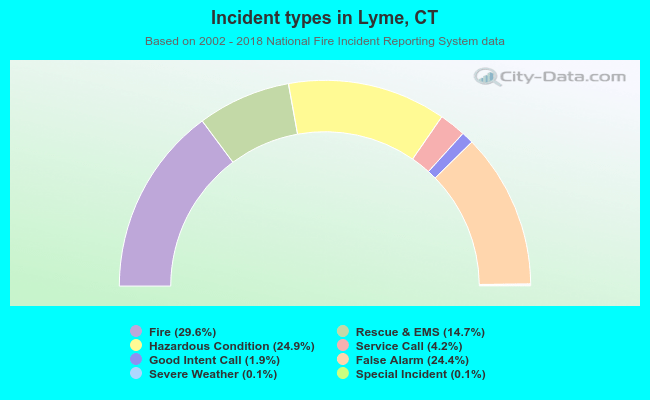 Out of all 722 cases reported during the years 2002 - 2018, the most belonged to the categories: Fire (29.6%), Rescue & EMS (24.9%), and Good Intent Call (24.4%).
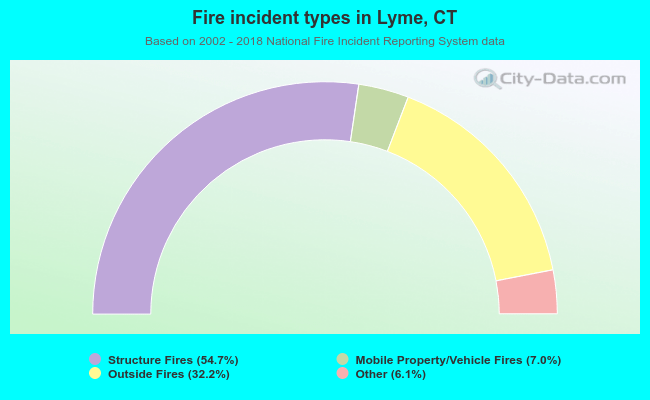 When looking into fire subcategories, the most reports belonged to: Structure Fires (54.7%), and Outside Fires (32.2%).