| Fire incidents reported |
|---|
| Sreet name | Count |
|---|
| 289 NORTH HWY | 30 | | HWY 9 | 20 | | 9 HWY | 18 | | HWY 63 | 18 | | US 63 HWY | 18 | | HWY 63 SOUTH | 16 | | BUSH RUN RD | 10 | | SYCAMORE CREEK CIR | 10 | | 289 HWY | 8 | | CAVE CREEK ROAD | 8 | | MAIN STREET | 8 | | TIMBER RIDGE RD | 8 | | WIRTH RD | 8 | | 175 HWY | 6 | | BAYOU ACCESS RD | 6 | | LONG RUN ROAD | 6 | | MANY ISLANDS RD | 6 | | OLD SALEM RD | 6 | | RAINBOW VALLEY TRAIL | 6 | | RIVERBEND ROAD | 6 | | TATE AVE | 6 | | WIRTH ROAD | 6 | | 128 PLEASANT RUN ROAD | 4 | | 132 IVEY TRAIL | 4 | | 1900 ARK 175 APPROX | 4 |
| | | Fire incidents reported |
|---|
| Sreet name | Count |
|---|
| 206 CAVE CREEK ROAD | 4 | | 358 CREEKWOOD TRL | 4 | | 419 CAVE CREEK ROAD | 4 | | 67 TRAW LANE | 4 | | ARCHER AVE | 4 | | BAMBER AVE | 4 | | BAYOU ACCESS | 4 | | BLACK OAK ROAD | 4 | | BROADLEAF RD | 4 | | ELM CREEK RD | 4 | | FIELD CREEK RD | 4 | | FRYATT CEMETERY RD | 4 | | GOLDSMITH AVE | 4 | | HWY 289 | 4 | | LONG RUN RD | 4 | | MUSIC HALL LANE | 4 | | MUSIC HALL LN | 4 | | NORTH FAIRVIEW | 4 | | PINE CONE LANE | 4 | | STATE LINE RD | 4 | | TATE | 4 | | WALKER AVE | 4 | | 1 12 MILES DOWN NEWSOM TRL | 2 | | 1/2 MILE OFF RTE 63 ON WIRTH R | 2 | | |
|
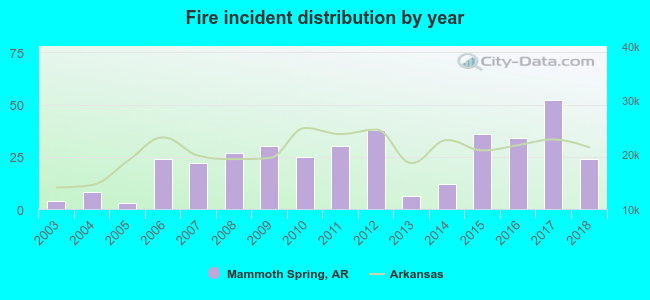 According to the data from the years 2003 - 2018 the average number of fire incidents per year is 23. The highest number of reported fires - 52 took place in 2017, and the least - 3 in 2005. The data has a rising trend.
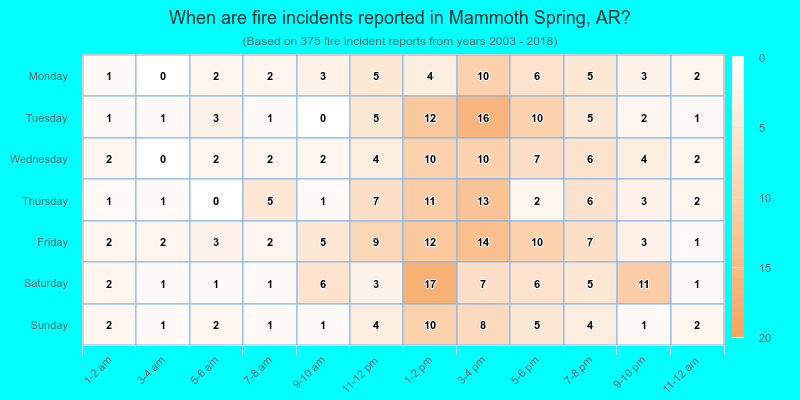
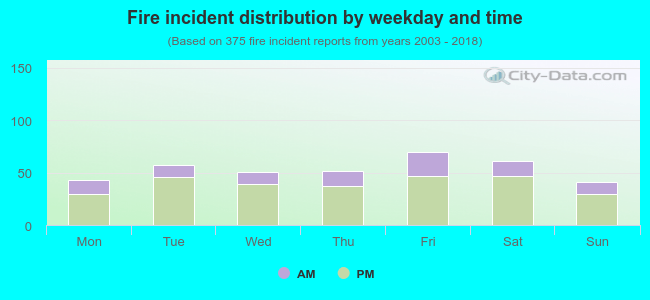 26.4% incidents where reported in the morning and 73.6% in the evening. The most fires (18.7%) took place on Friday, and the least (10.9%) on Sunday.
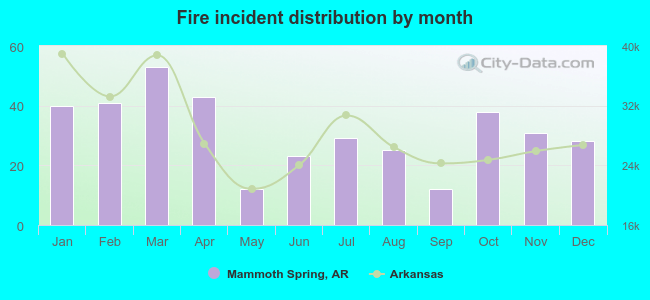 According to the 375 incident reports from years 2003 - 2018 most fires (14.1%) took place during March, and the least (3.2%) in May.
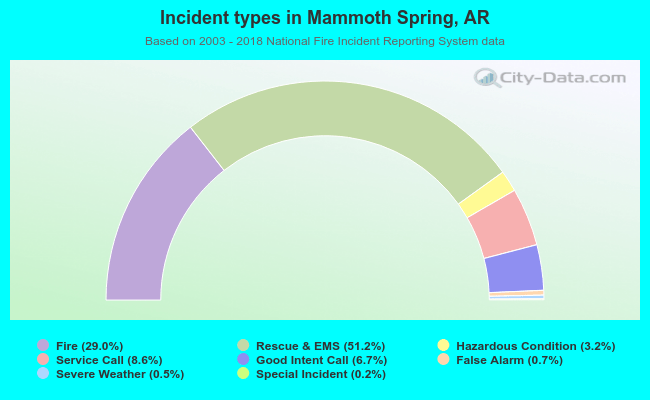 Out of all 1,295 cases reported during the years 2003 - 2018, the most belonged to the categories: Overpressure Rupture (51.2%), Fire (29.0%), and Hazardous Condition (8.6%).
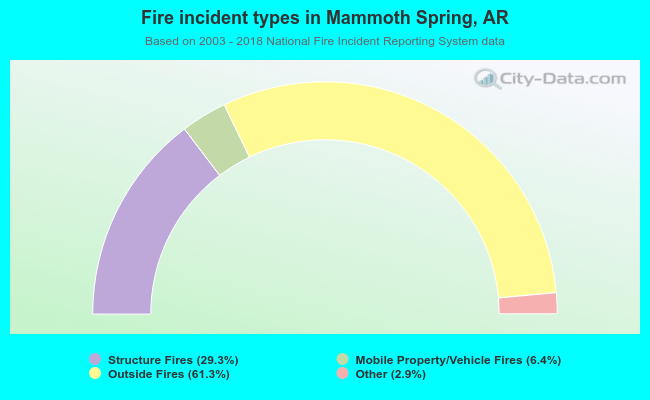 When looking into fire subcategories, the most incidents belonged to: Outside Fires (61.3%), and Structure Fires (29.3%).