Manlius: Fire Incidents, New York (NY)
Where are fire incidents reported in Manlius, NY
Something went wrong! Please refresh the page.
| Fire incidents reported | |
|---|---|
| Sreet name | Count |
| SENECA ST | 162 |
| SENECA TPKE | 80 |
| CAZENOVIA RD | 68 |
| POMPEY CENTER RD | 66 |
| FAYETTE ST | 50 |
| INDIAN HILL RD | 50 |
| HIGHBRIDGE RD | 48 |
| ORAN DELPHI RD | 46 |
| WATERVALE RD | 42 |
| PALMER RD | 38 |
| PLEASANT ST | 32 |
| SALT SPRINGS RD | 32 |
| SUBURBAN PARK DR | 26 |
| WILLOWBROOK LN | 26 |
| BROADFIELD RD | 24 |
| HENNEBERRY RD | 22 |
| TROUT LILY LN | 22 |
| ELMBROOK DR | 20 |
| VERBECK DR | 20 |
| HUNTWOOD PATH | 18 |
| STICKLEY DR | 18 |
| STRAWBERRY LN | 18 |
| SWEET RD | 18 |
| GATES RD | 16 |
| NUMBER 4 RD | 16 |
| PRESTWICK DR | 16 |
| BRAE LEURE RD | 14 |
| HOBNAIL RD | 14 |
| LIMBERLOST LN | 14 |
| MILL ST | 14 |
2003 - 2018 National Fire Incident Reporting System (NFIRS) incidents
- Incident types reported to NFIRS in Manlius, NY
- 1,93835.4%Rescue & EMS
- 97017.7%False Alarm
- 95817.5%Fire
- 73813.5%Good Intent Call
- 65011.9%Hazardous Condition
- 1983.6%Service Call
- 150.3%Severe Weather
- 60.1%Overpressure Rupture
- Fire incident types reported to NFIRS in Manlius, NY
- 68871.8%Structure Fires
- 15616.3%Outside Fires
- 677.0%Mobile Property/Vehicle Fires
- 474.9%Other
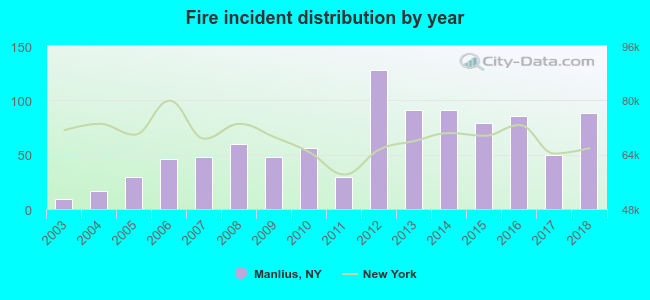 Based on the data from the years 2003 - 2018 the average number of fire incidents per year is 60. The highest number of fire incidents - 128 took place in 2012, and the least - 9 in 2003. The data has an increasing trend.
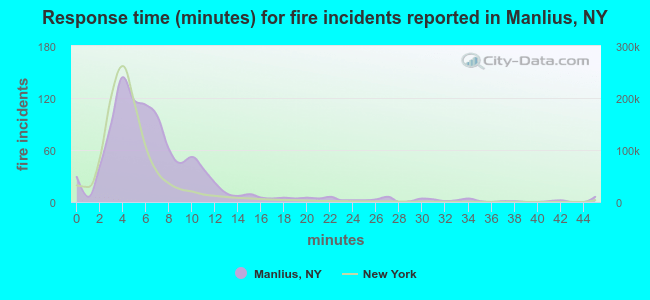 The median response time based on all reported fire incidents is 6 minutes. This is higher than the New York median value.
The median response time in Manlius, NY compared to nearest cities:
(Note: Based on data for all years, including only cities with at least 500 fire incidents)
| Manlius: | 6 minutes |
| Fayetteville: | 5 minutes |
| Chittenango: | 11 minutes |
| East Syracuse: | 5 minutes |
| Syracuse: | 3 minutes |
| Mattydale: | 5 minutes |
| North Syracuse: | 7 minutes |
| Canastota: | 10 minutes |
| Cicero: | 8 minutes |
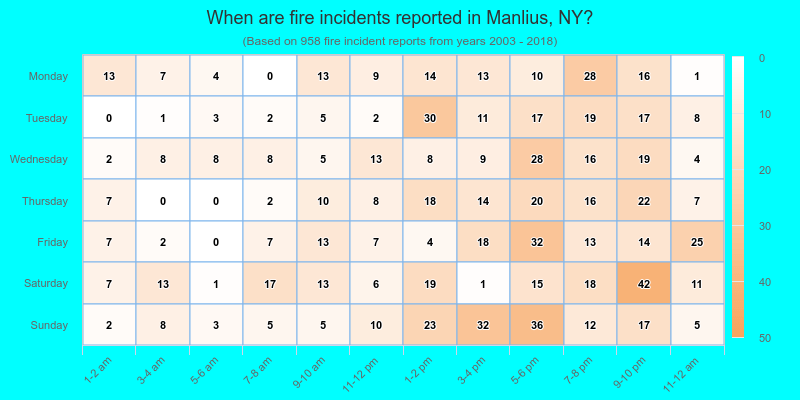
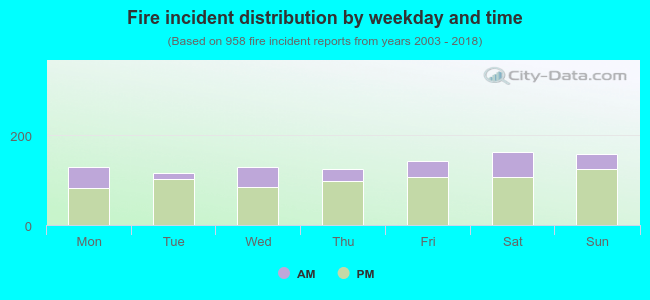 26.7% incidents where reported in the morning and 73.3% in the evening. The most fires (17.0%) took place on Saturday, and the least (12.0%) on Tuesday.
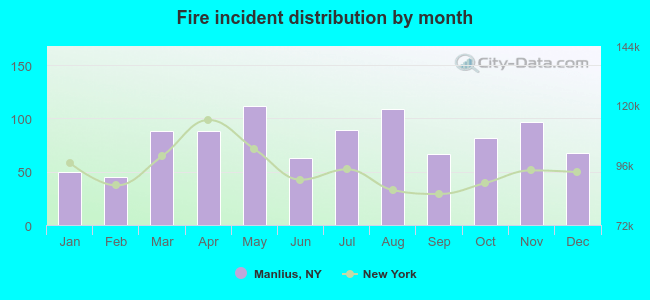 According to the 958 incident reports from years 2003 - 2018 most fires (11.7%) took place during May, and the least (4.7%) in February.
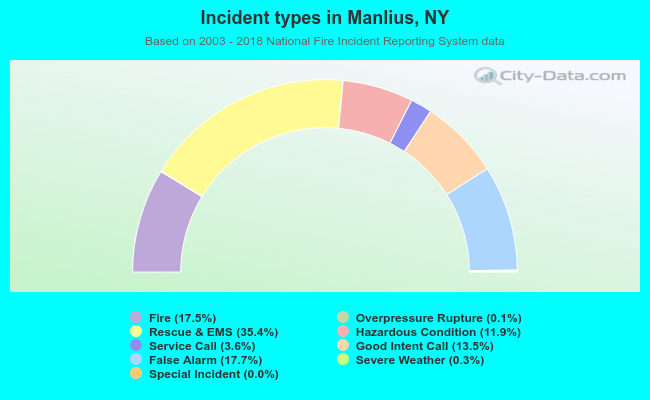 Out of all 5,474 cases reported during the years 2003 - 2018, the most belonged to the categories: Rescue & EMS (35.4%), False Alarm (17.7%), and Fire (17.5%).
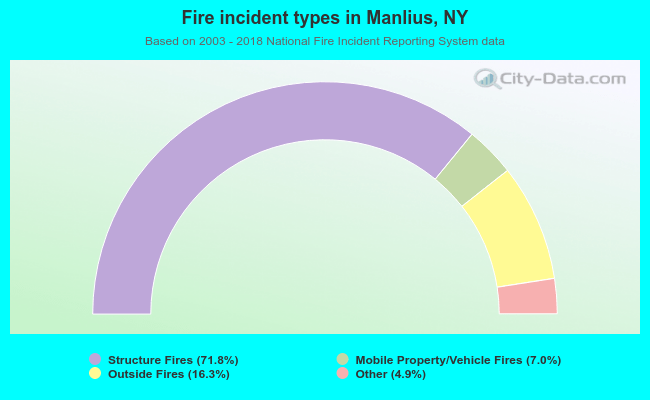 When looking into fire subcategories, the most reports belonged to: Structure Fires (71.8%), and Outside Fires (16.3%).