Marengo: Fire Incidents, Illinois (IL)
Where are fire incidents reported in Marengo, IL
Something went wrong! Please refresh the page.
|
| |||||||||||||||||||||||||||||||||||||||||||||||||||||||||||||||||||||||||||||||||||||||||||||||||||||||||||||
2002 - 2018 National Fire Incident Reporting System (NFIRS) incidents
- Incident types reported to NFIRS in Marengo, IL
- 1,80644.1%Rescue & EMS
- 75318.4%Fire
- 60314.7%Hazardous Condition
- 3257.9%False Alarm
- 3057.5%Good Intent Call
- 2826.9%Service Call
- 80.2%Severe Weather
- 70.2%Overpressure Rupture
- Fire incident types reported to NFIRS in Marengo, IL
- 31041.2%Structure Fires
- 30941.0%Outside Fires
- 8711.6%Mobile Property/Vehicle Fires
- 476.2%Other
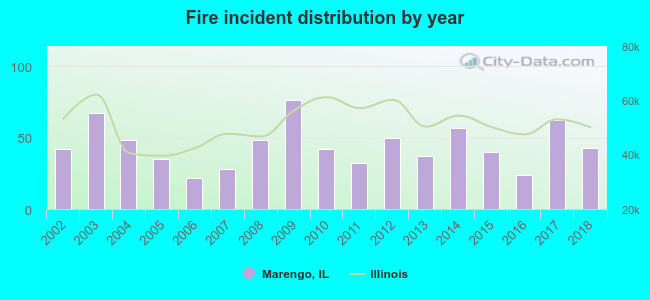 According to the data from the years 2002 - 2018 the average number of fire incidents per year is 44. The highest number of fires - 76 took place in 2009, and the least - 22 in 2006. The data has a growing trend.
The average number of yearly fire incidents per 10k residents in Marengo, IL compared to nearest cities:
(Note: Based on data for the last 3 years, including only cities with population 5,000 and above)
| Marengo: | 57.3 |
| Woodstock: | 38.0 |
| Huntley: | 21.0 |
| Hampshire: | 84.2 |
| Genoa: | 68.9 |
| Harvard: | 53.8 |
| Belvidere: | 48.8 |
| Poplar Grove: | 31.0 |
| Crystal Lake: | 24.9 |
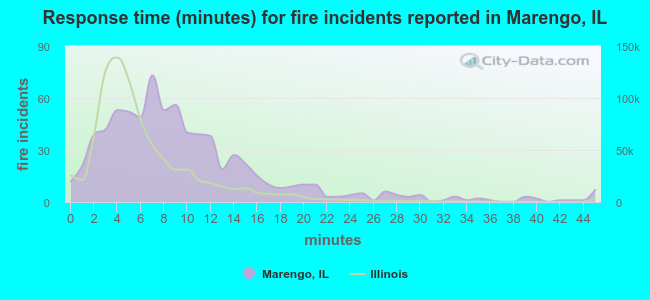 The median response time based on all reported fire incidents is 8 minutes. This is higher than the state median value.
The median response time in Marengo, IL compared to nearest cities:
(Note: Based on data for all years, including only cities with at least 500 fire incidents)
| Marengo: | 8 minutes |
| Woodstock: | 6 minutes |
| Huntley: | 7 minutes |
| Hampshire: | 9 minutes |
| Genoa: | 11 minutes |
| Harvard: | 9 minutes |
| Belvidere: | 5 minutes |
| Crystal Lake: | 6 minutes |
| Lake in the Hills: | 5 minutes |
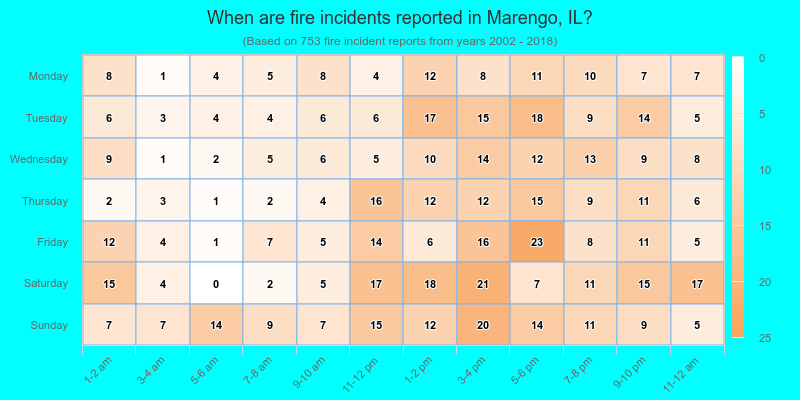
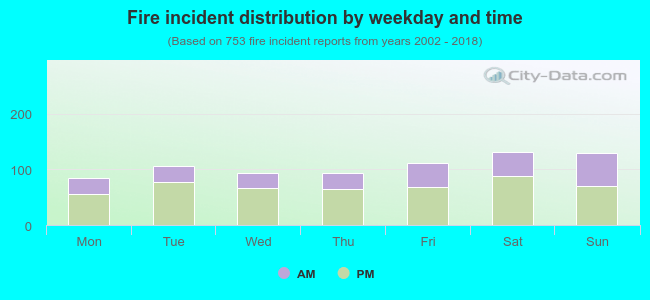 34.5% incidents where reported in the morning and 65.5% in the evening. The most fires (17.5%) took place on Saturday, and the least (11.3%) on Monday.
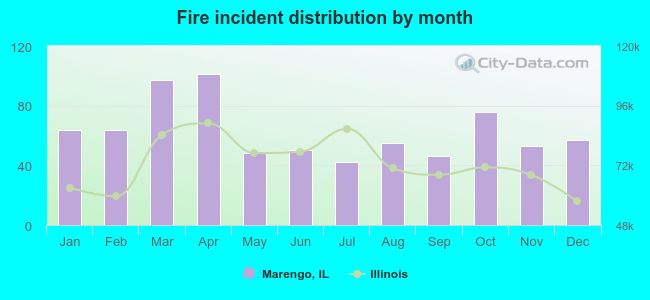 According to the 753 fires from years 2002 - 2018 most fires (13.4%) took place during April, and the least (5.6%) in July.
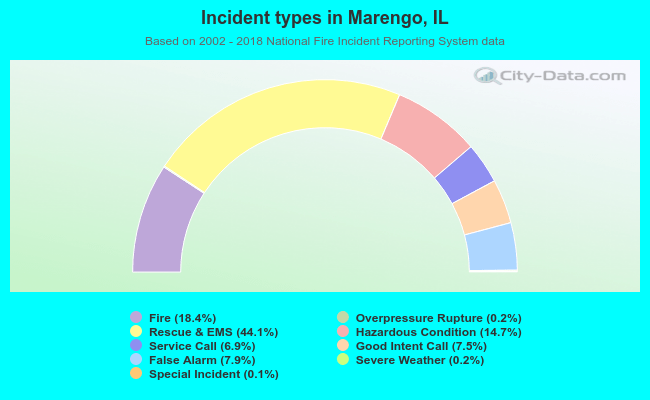 Out of all 4,093 cases reported during the years 2002 - 2018, the most belonged to the categories: Rescue & EMS (44.1%), Fire (18.4%), and Hazardous Condition (14.7%).
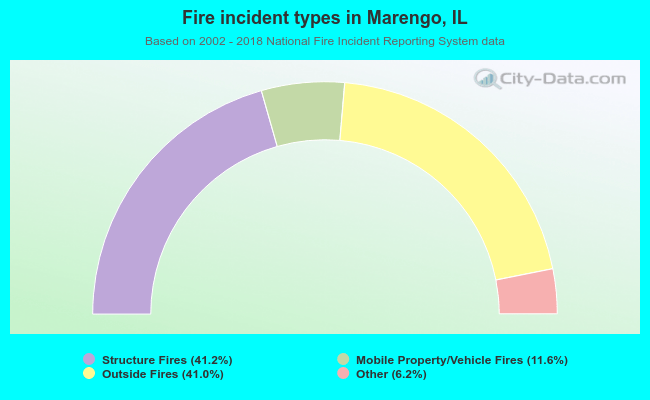 When looking into fire subcategories, the most reports belonged to: Structure Fires (41.2%), and Outside Fires (41.0%).