Marshall: Fire Incidents, Missouri (MO)
Where are fire incidents reported in Marshall, MO
Something went wrong! Please refresh the page.
|
| |||||||||||||||||||||||||||||||||||||||||||||||||||||||||||||||||||||||||||||||||||||||||||||||||||||||||||||
| Other | 185 | |||||||||||||||||||||||||||||||||||||||||||||||||||||||||||||||||||||||||||||||||||||||||||||||||||||||||||||
2002 - 2018 National Fire Incident Reporting System (NFIRS) incidents
- Incident types reported to NFIRS in Marshall, MO
- 95027.9%Rescue & EMS
- 78123.0%Fire
- 65819.4%Hazardous Condition
- 46113.6%Service Call
- 2818.3%Good Intent Call
- 2326.8%False Alarm
- 290.9%Overpressure Rupture
- 80.2%Special Incident
- Fire incident types reported to NFIRS in Marshall, MO
- 30839.4%Structure Fires
- 30038.4%Outside Fires
- 13417.2%Mobile Property/Vehicle Fires
- 395.0%Other
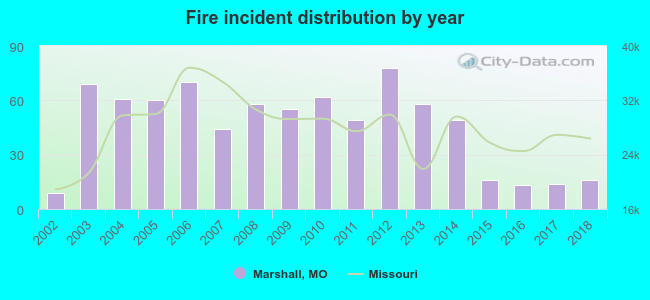 Based on the data from the years 2002 - 2018 the average number of fire incidents per year is 46. The highest number of reported fires - 78 took place in 2012, and the least - 9 in 2002. The data has a rising trend.
The average number of yearly fire incidents per 10k residents in Marshall, MO compared to nearest cities:
(Note: Based on data for the last 3 years, including only cities with population 5,000 and above)
| Marshall: | 11.0 |
| Boonville: | 95.9 |
| Sedalia: | 88.7 |
| Warrensburg: | 62.9 |
| Odessa: | 127.6 |
| Richmond: | 70.4 |
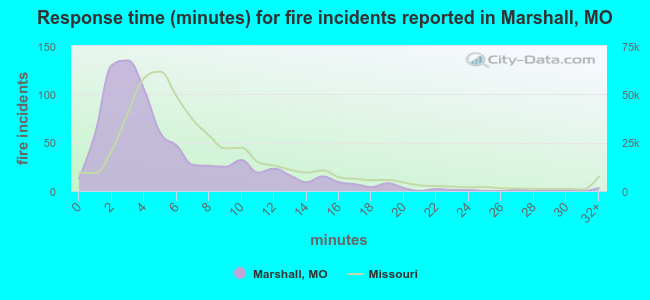 The median response time based on all reported fire incidents is 4 minutes. This is lower than the Missouri median value.
The median response time in Marshall, MO compared to nearest cities:
(Note: Based on data for all years, including only cities with at least 500 fire incidents)
| Marshall: | 4 minutes |
| Carrollton: | 7 minutes |
| Boonville: | 5 minutes |
| Higginsville: | 8 minutes |
| Sedalia: | 5 minutes |
| Lexington: | 7 minutes |
| Warrensburg: | 6 minutes |
| Odessa: | 9 minutes |
| Richmond: | 7 minutes |
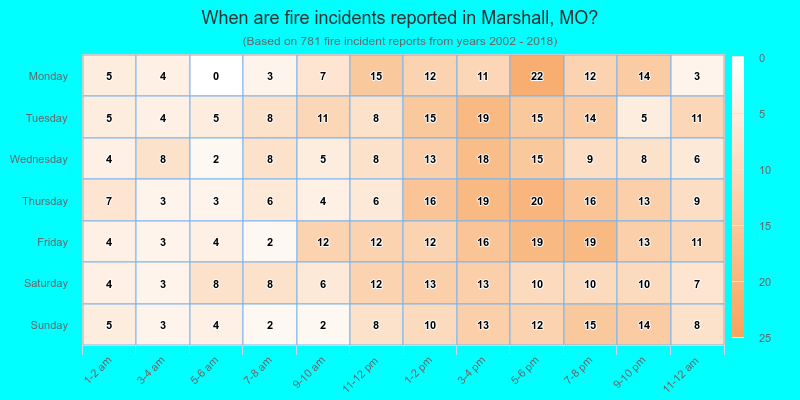
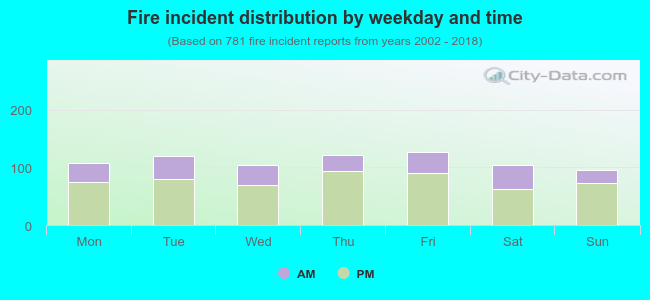 30.9% incidents where reported in the morning and 69.1% in the evening. The most fires (16.3%) took place on Friday, and the least (12.3%) on Sunday.
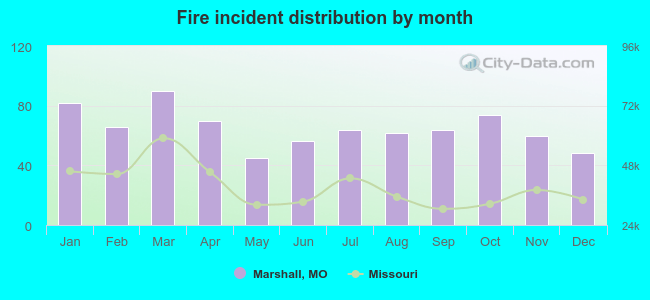 According to the 781 incident reports from years 2002 - 2018 most fires (11.5%) took place during March, and the least (5.8%) in May.
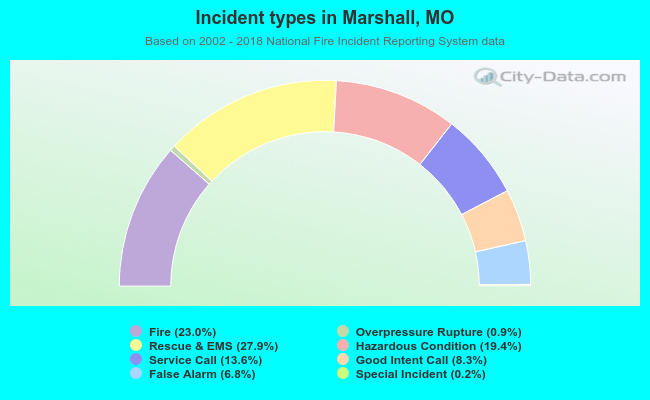 Out of all 3,400 cases reported during the years 2002 - 2018, the most belonged to the categories: Rescue & EMS (27.9%), Fire (23.0%), and Hazardous Condition (19.4%).
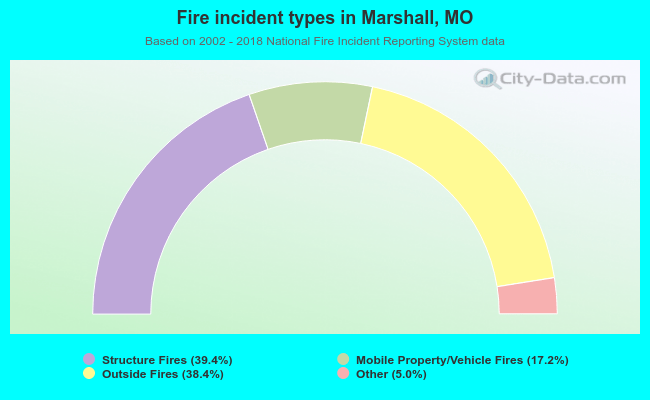 When looking into fire subcategories, the most reports belonged to: Structure Fires (39.4%), and Outside Fires (38.4%).