| Fire incidents reported |
|---|
| Sreet name | Count |
|---|
| ST HWY 30 | 36 | | STATE HWY 30 | 20 | | ST HWY 29 | 16 | | CTY HWY 123 | 14 | | STATE HIGHWAY 30 | 14 | | STATE HWY 29 | 12 | | CO. HWY 106 | 10 | | CO HWY 123 | 8 | | COUNTY HIGHWAY 123 | 8 | | LAKESIDE DR. | 8 | | LAKESIDE DRIVE | 8 | | STATE HWY. 30 | 8 | | CO. HWY 155 | 6 | | DENNIE RD. | 6 | | DENNY LOOP RD. | 6 | | GRIFFIS RD | 6 | | HOUSEMAN ST. | 6 | | JACKSON SUMMIT RD | 6 | | NORTH MAIN ST | 6 | | SCHOOL STREET | 6 | | SCHOOL STREET ST | 6 | | ST HWY 29 A | 6 | | WOODSIDE AVE. | 6 | | BEECH STREET | 4 | | BUNKER HILL | 4 |
| | | Fire incidents reported |
|---|
| Sreet name | Count |
|---|
| CAMP ROAD | 4 | | COUNTY HWY 157 HWY | 4 | | CTY HWY 102 | 4 | | CTY HWY 146 | 4 | | GILBERT RD. | 4 | | GRIFFIS | 4 | | GRIFFIS ROAD | 4 | | HOUSEMAN ST | 4 | | JACKSON SUMMIT RD | 4 | | JACKSON SUMMIT RD. W. | 4 | | JACKSON SUMMIT WEST RD | 4 | | LAKESIDE DR | 4 | | N. MAIN ST | 4 | | N. MAIN ST. | 4 | | PATTON | 4 | | PROGRESS | 4 | | SAND HILL RD | 4 | | SECOND AVE | 4 | | ST HWY 349 | 4 | | ST. HWY 30 | 4 | | TOWN ROAD | 4 | | VANDENBURG PT RD | 4 | | W. MAIN ST | 4 | | WOODS HOLLOW | 4 | | YATES RD | 4 |
|
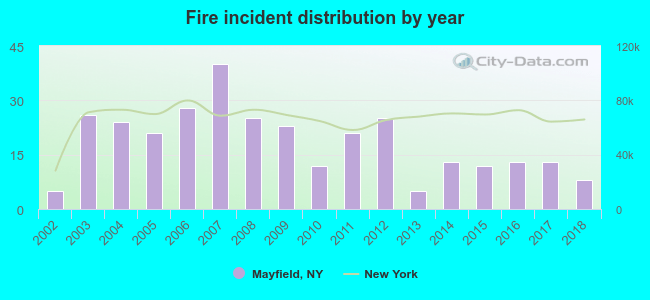 Based on the data from the years 2002 - 2018 the average number of fire incidents per year is 18. The highest number of reported fire incidents - 40 took place in 2007, and the least - 5 in 2002. The data has a rising trend.
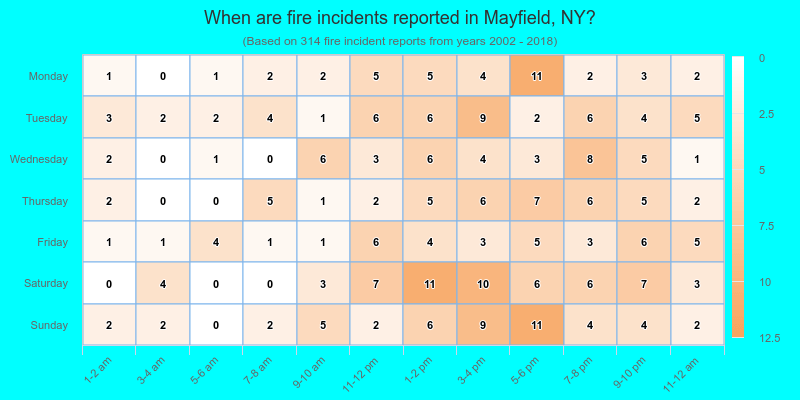
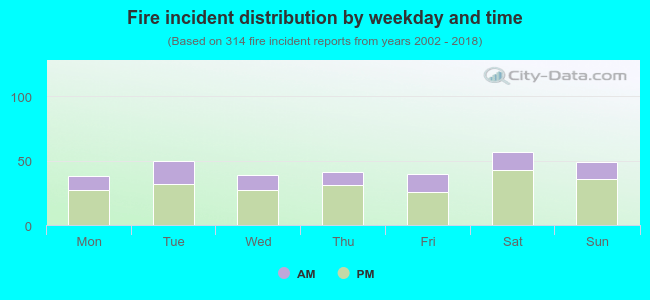 29.3% incidents where reported in the morning and 70.7% in the evening. The most fires (18.2%) took place on Saturday, and the least (12.1%) on Monday.
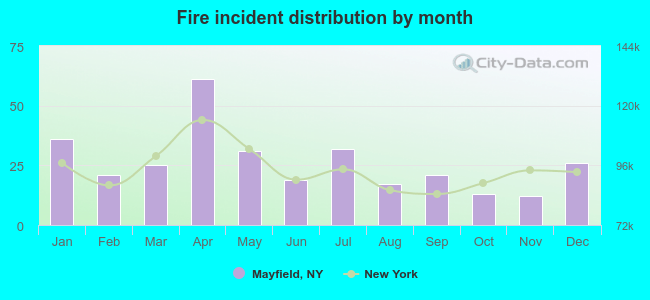 According to the 314 incident reports from years 2002 - 2018 most fires (19.4%) took place during April, and the least (3.8%) in November.
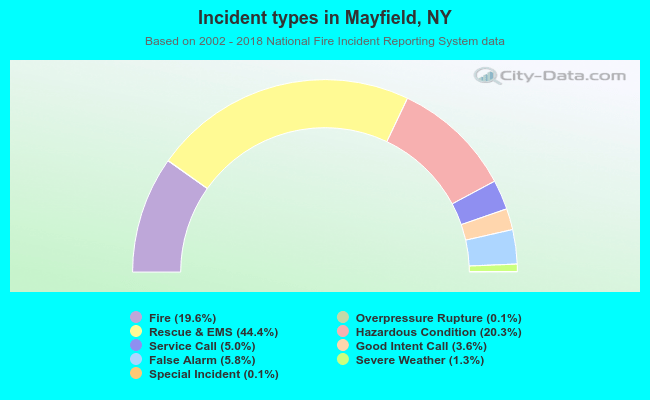 Out of all 1,600 cases reported during the years 2002 - 2018, the most belonged to the categories: Rescue & EMS (44.4%), Hazardous Condition (20.3%), and Fire (19.6%).
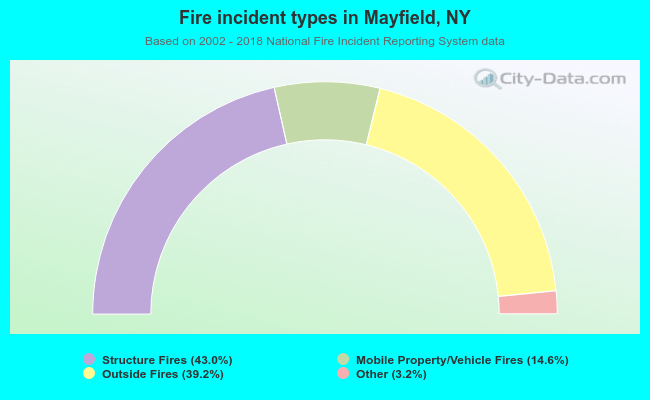 When looking into fire subcategories, the most reports belonged to: Structure Fires (43.0%), and Outside Fires (39.2%).