McHenry: Fire Incidents, Illinois (IL)
Where are fire incidents reported in McHenry, IL
Something went wrong! Please refresh the page.
| Fire incidents reported | |
|---|---|
| Sreet name | Count |
| ELM ST | 126 |
| RICHMOND RD | 120 |
| RINGWOOD RD | 102 |
| RIVER RD | 82 |
| ROUTE 120 | 82 |
| BULL VALLEY RD | 80 |
| RIVERSIDE DR | 70 |
| LINCOLN RD | 66 |
| MAIN ST | 54 |
| MCCULLOM LAKE RD | 52 |
| ROUTE 31 | 50 |
| JOHNSBURG RD | 48 |
| ORLEANS ST | 48 |
| KANE AVE | 42 |
| CHAPEL HILL RD | 40 |
| GREEN ST | 40 |
| CRYSTAL LAKE RD | 36 |
| DRAPER RD | 36 |
| LILY LAKE RD | 36 |
| DARRELL RD | 28 |
| LILLIAN ST | 28 |
| FRONT ST | 24 |
| GARDEN QUARTER RD | 24 |
| JAMES ST | 24 |
| WAUKEGAN RD | 24 |
| ELM | 22 |
| RIVER TERRACE DR | 22 |
| SHAMROCK LN | 22 |
| SILVER GLEN RD | 22 |
| WILDWOOD DR | 22 |
| Other | 770 |
2002 - 2018 National Fire Incident Reporting System (NFIRS) incidents
- Incident types reported to NFIRS in McHenry, IL
- 19,78666.9%Rescue & EMS
- 2,3457.9%Hazardous Condition
- 2,2427.6%Fire
- 2,2377.6%Service Call
- 1,8766.3%False Alarm
- 1,0363.5%Good Intent Call
- Fire incident types reported to NFIRS in McHenry, IL
- 94442.1%Outside Fires
- 91740.9%Structure Fires
- 29513.2%Mobile Property/Vehicle Fires
- 863.8%Other
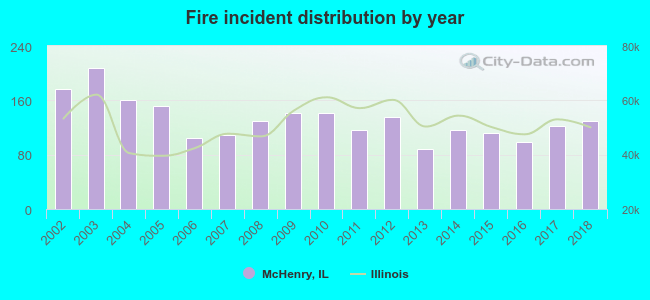 According to the data from the years 2002 - 2018 the average number of fire incidents per year is 132. The highest number of fires - 208 took place in 2003, and the least - 89 in 2013. The data has a dropping trend.
The average number of yearly fire incidents per 10k residents in McHenry, IL compared to nearest cities:
(Note: Based on data for the last 3 years, including only cities with population 5,000 and above)
| McHenry: | 43.8 |
| Johnsburg: | 24.4 |
| Lakemoor: | 28.3 |
| Wonder Lake: | 37.5 |
| Island Lake: | 28.6 |
| Fox Lake: | 42.2 |
| Spring Grove: | 71.0 |
| Crystal Lake: | 24.9 |
| Woodstock: | 38.0 |
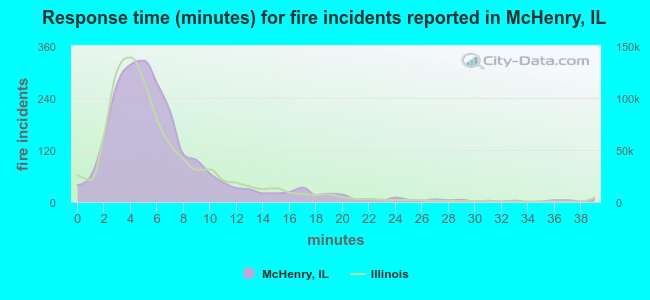 The median response time based on all reported fire incidents is 5 minutes. This is similar to the Illinois median value.
The median response time in McHenry, IL compared to nearest cities:
(Note: Based on data for all years, including only cities with at least 500 fire incidents)
| McHenry: | 5 minutes |
| Wonder Lake: | 7 minutes |
| Fox Lake: | 6 minutes |
| Spring Grove: | 6 minutes |
| Crystal Lake: | 6 minutes |
| Woodstock: | 6 minutes |
| Wauconda: | 6 minutes |
| Cary: | 5 minutes |
| Richmond: | 6 minutes |
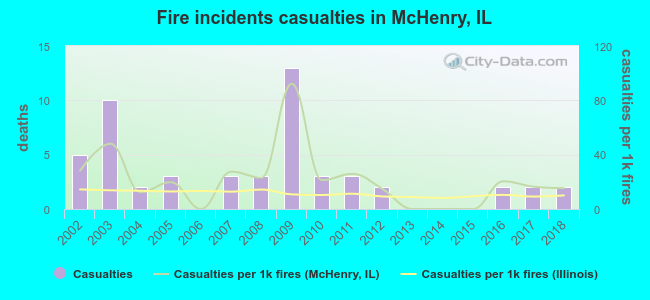 Based on the reports from the years 2002 - 2018 the average number of fire-related yearly casualties is 3. The highest number of casualties - 13 took place in 2009, and the lowest - 0 in 2006. The data has a dropping trend.
The average number of injuries per 1,000 fire incidents is 21. This indicator was the highest - 92 in 2009, and the lowest 0 in 2006. The trend for casualties per 1,000 fire incidents is decreasing. Compared to the state value the number of casualties per 1,000 incidents is much higher.
Based on the reports from the years 2002 - 2018 the average number of fire-related yearly casualties is 3. The highest number of casualties - 13 took place in 2009, and the lowest - 0 in 2006. The data has a dropping trend.
The average number of injuries per 1,000 fire incidents is 21. This indicator was the highest - 92 in 2009, and the lowest 0 in 2006. The trend for casualties per 1,000 fire incidents is decreasing. Compared to the state value the number of casualties per 1,000 incidents is much higher.Casualties per 1,000 incidents in McHenry, IL compared to nearest cities:
(Note: Based on data for all years, including only cities with at least 500 fire incidents)
| McHenry: | 23.6 |
| Wonder Lake: | 0.0 |
| Fox Lake: | 2.8 |
| Spring Grove: | 2.5 |
| Crystal Lake: | 9.7 |
| Woodstock: | 12.7 |
| Wauconda: | 7.1 |
| Cary: | 1.4 |
| Richmond: | 7.9 |
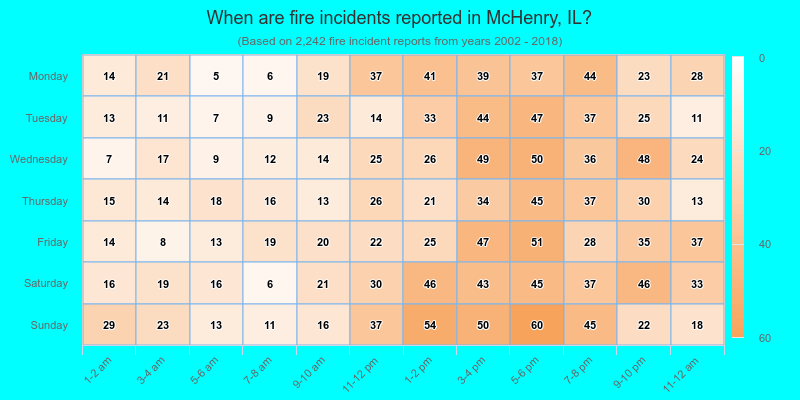
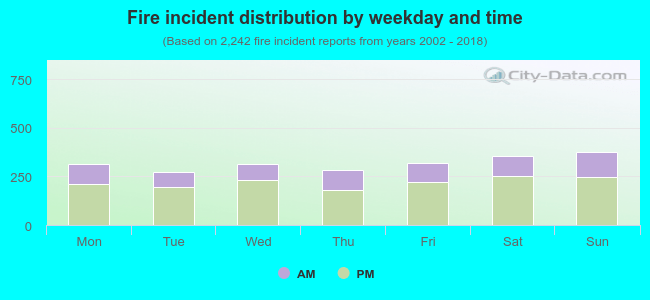 31.1% incidents where reported in the morning and 68.9% in the evening. The most fires (16.9%) took place on Sunday, and the least (12.2%) on Tuesday.
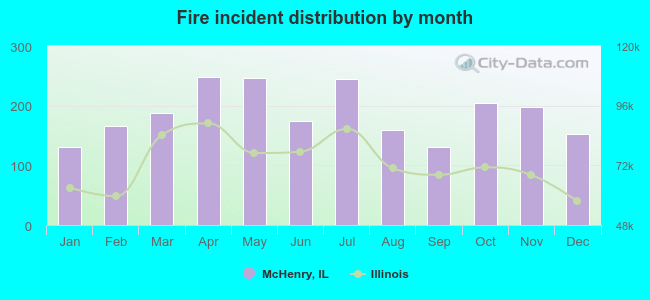 Based on the 2,242 reports from years 2002 - 2018 most fires (11.1%) took place during April, and the least (5.8%) in January.
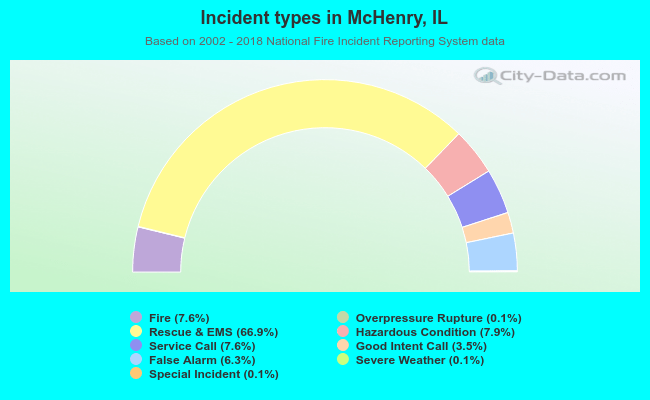 Out of all 29,587 cases reported during the years 2002 - 2018, the most belonged to the categories: Rescue & EMS (66.9%), Hazardous Condition (7.9%), and Fire (7.6%).
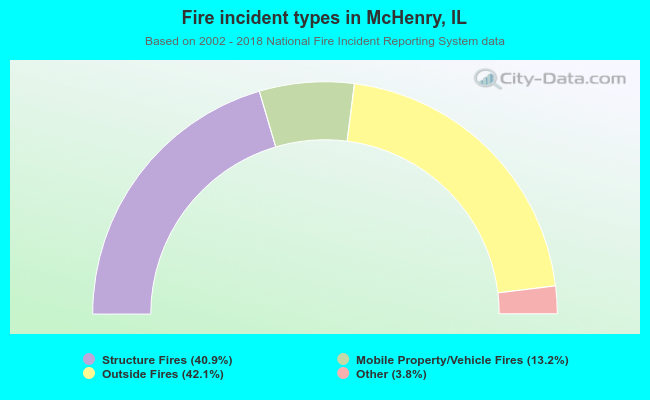 When looking into fire subcategories, the most incidents belonged to: Outside Fires (42.1%), and Structure Fires (40.9%).