Mercer Island: Fire Incidents, Washington (WA)
Where are fire incidents reported in Mercer Island, WA
Something went wrong! Please refresh the page.
| Fire incidents reported | |
|---|---|
| Sreet name | Count |
| MERCER WAY | 238 |
| 78TH AVE | 94 |
| 76TH AVE | 52 |
| 24TH ST | 46 |
| 27TH ST | 44 |
| ISLAND CREST WAY | 44 |
| 80TH AVE | 36 |
| SHOREWOOD DR | 34 |
| 30TH ST | 30 |
| 40TH ST | 30 |
| 88TH AVE | 30 |
| 84TH AVE | 28 |
| 90TH AVE | 28 |
| 86TH AVE | 24 |
| FORTUNA DR | 24 |
| 72ND AVE | 20 |
| 78TH ST | 20 |
| WB 90 | 20 |
| 28TH ST | 16 |
| 91ST AVE | 16 |
| 68TH ST | 14 |
| 72ND ST | 14 |
| 77TH AVE | 14 |
| 36TH ST | 12 |
| 46TH ST | 12 |
| 60TH AVE | 12 |
| 71ST ST | 12 |
| 81ST AVE | 12 |
| 82ND AVE | 12 |
| 58TH ST | 10 |
2002 - 2018 National Fire Incident Reporting System (NFIRS) incidents
- Incident types reported to NFIRS in Mercer Island, WA
- 7,61462.8%Rescue & EMS
- 1,28510.6%Good Intent Call
- 1,1189.2%False Alarm
- 7426.1%Fire
- 6485.3%Service Call
- 6475.3%Hazardous Condition
- 480.4%Severe Weather
- Fire incident types reported to NFIRS in Mercer Island, WA
- 32844.2%Structure Fires
- 24432.9%Outside Fires
- 8811.9%Other
- 8211.1%Mobile Property/Vehicle Fires
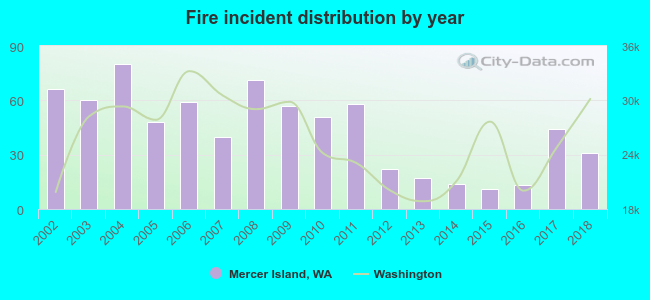 Based on the data from the years 2002 - 2018 the average number of fire incidents per year is 44. The highest number of reported fire incidents - 80 took place in 2004, and the least - 11 in 2015. The data has a decreasing trend.
The average number of yearly fire incidents per 10k residents in Mercer Island, WA compared to nearest cities:
(Note: Based on data for the last 3 years, including only cities with population 5,000 and above)
| Mercer Island: | 12.1 |
| Newcastle: | 17.9 |
| Bellevue: | 26.4 |
| Renton: | 52.4 |
| Seattle: | 33.2 |
| Tukwila: | 102.1 |
| Kirkland: | 6.4 |
| Redmond: | 21.2 |
| Burien: | 39.4 |
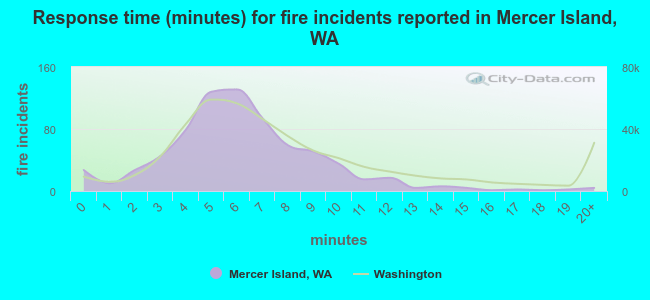 The median response time based on all reported fire incidents is 6 minutes. This is close to the state median value.
The median response time in Mercer Island, WA compared to nearest cities:
(Note: Based on data for all years, including only cities with at least 500 fire incidents)
| Mercer Island: | 6 minutes |
| Bellevue: | 6 minutes |
| Renton: | 6 minutes |
| Seattle: | 5 minutes |
| Tukwila: | 6 minutes |
| Kirkland: | 6 minutes |
| Redmond: | 6 minutes |
| Burien: | 5 minutes |
| Issaquah: | 7 minutes |
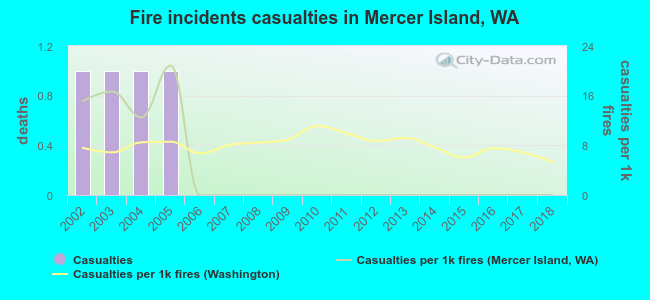 Based on the data from the years 2002 - 2018 the average number of fire-related yearly casualties is 0. The highest number of reported injuries - 1 took place in 2002, and the lowest - 0 in 2006. The data has a dropping trend.
The average number of casualties per 1,000 fire incidents is 4. This indicator was the highest - 21 in 2005, and the lowest 0 in 2006. The trend for casualties per 1,000 fire incidents is declining. Compared to the state value the number of casualties per 1,000 fire incidents is lower.
Based on the data from the years 2002 - 2018 the average number of fire-related yearly casualties is 0. The highest number of reported injuries - 1 took place in 2002, and the lowest - 0 in 2006. The data has a dropping trend.
The average number of casualties per 1,000 fire incidents is 4. This indicator was the highest - 21 in 2005, and the lowest 0 in 2006. The trend for casualties per 1,000 fire incidents is declining. Compared to the state value the number of casualties per 1,000 fire incidents is lower.
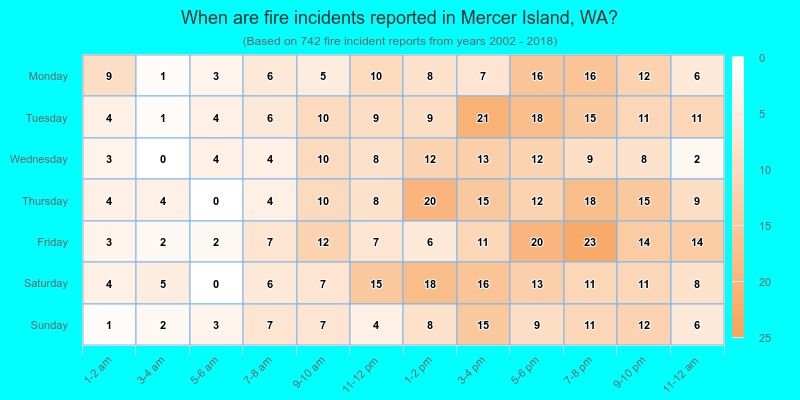
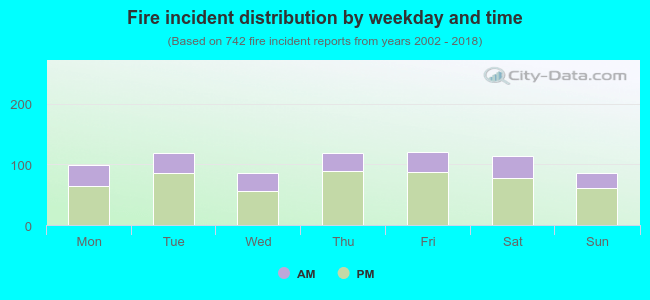 29.8% incidents where reported in the morning and 70.2% in the evening. The most fires (16.3%) took place on Friday, and the least (11.5%) on Wednesday.
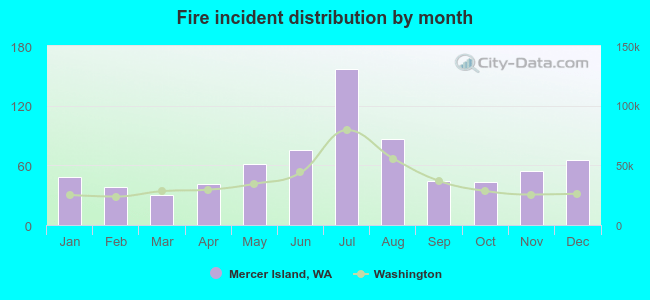 Based on the 742 incident reports from years 2002 - 2018 most fires (21.2%) took place during July, and the least (4.0%) in March.
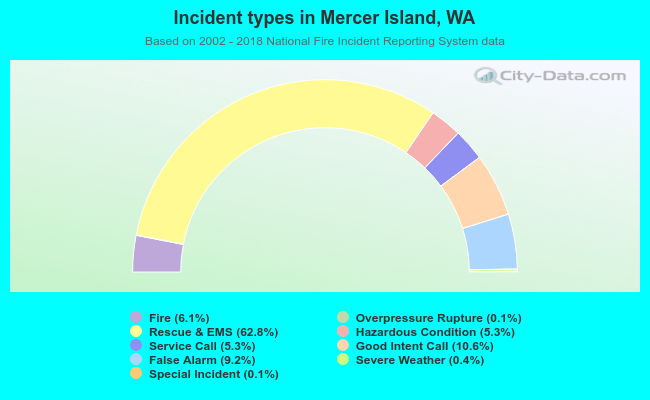 Out of all 12,122 cases reported during the years 2002 - 2018, the most belonged to the categories: Rescue & EMS (62.8%), Good Intent Call (10.6%), and False Alarm (9.2%).
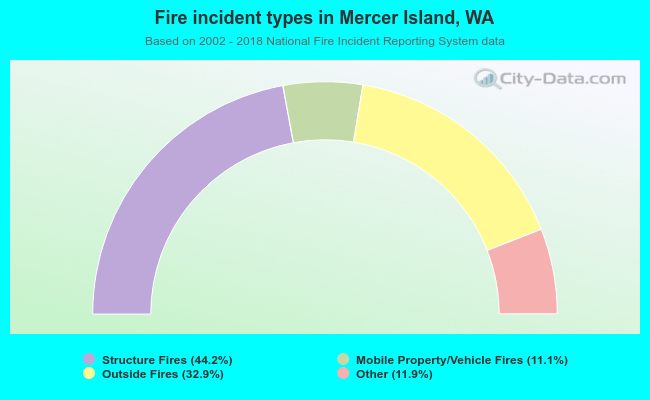 When looking into fire subcategories, the most reports belonged to: Structure Fires (44.2%), and Outside Fires (32.9%).