Minneota: Fire Incidents, Minnesota (MN)
Where are fire incidents reported in Minneota, MN
Something went wrong! Please refresh the page.
|
| |||||||||||||||||||||||||||||||||||||||||||||||||||||||||||||||||||||||||||||||||||||||||||||||||||||||||||||
| Other | 10 | |||||||||||||||||||||||||||||||||||||||||||||||||||||||||||||||||||||||||||||||||||||||||||||||||||||||||||||
2009 - 2018 National Fire Incident Reporting System (NFIRS) incidents
- Incident types reported to NFIRS in Minneota, MN
- 16067.2%Fire
- 4117.2%Rescue & EMS
- 104.2%Hazardous Condition
- 104.2%False Alarm
- 52.1%Service Call
- 52.1%Good Intent Call
- 52.1%Severe Weather
- 10.4%Overpressure Rupture
- 10.4%Special Incident
- Fire incident types reported to NFIRS in Minneota, MN
- 5534.4%Structure Fires
- 5433.8%Outside Fires
- 2918.1%Mobile Property/Vehicle Fires
- 2213.8%Other
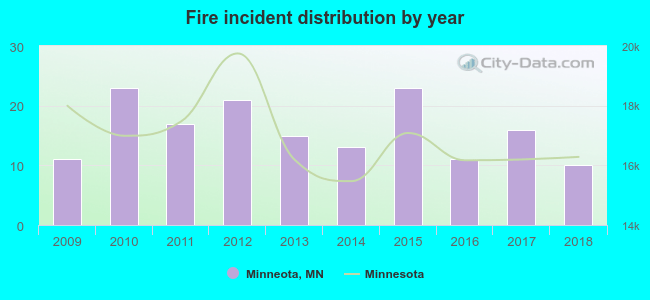 Based on the data from the years 2009 - 2018 the average number of fires per year is 16. The highest number of fires - 23 took place in 2010, and the least - 10 in 2018. The data has a declining trend.
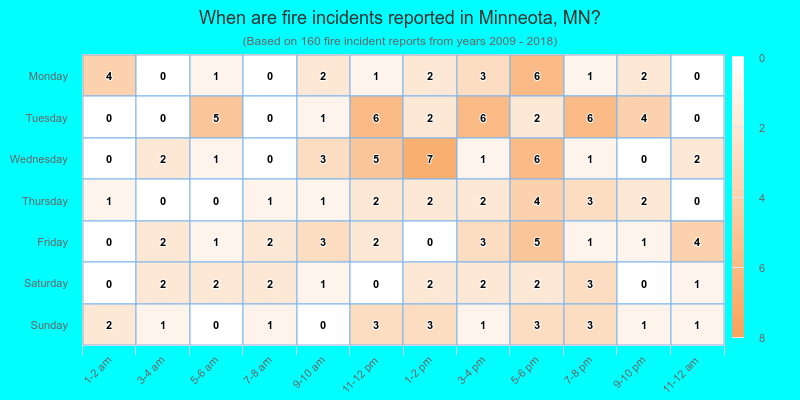
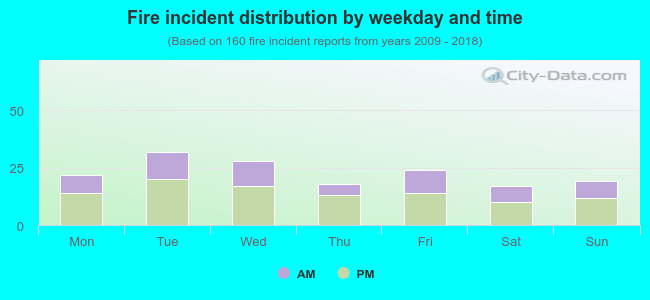 37.5% incidents where reported in the morning and 62.5% in the evening. The most fires (20.0%) took place on Tuesday, and the least (10.6%) on Saturday.
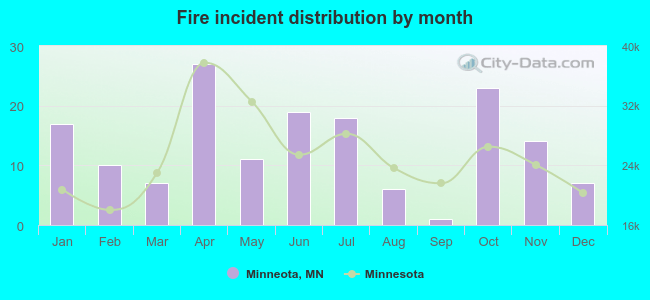 According to the 160 fire incidents from years 2009 - 2018 most fires (16.9%) took place during April, and the least (0.6%) in September.
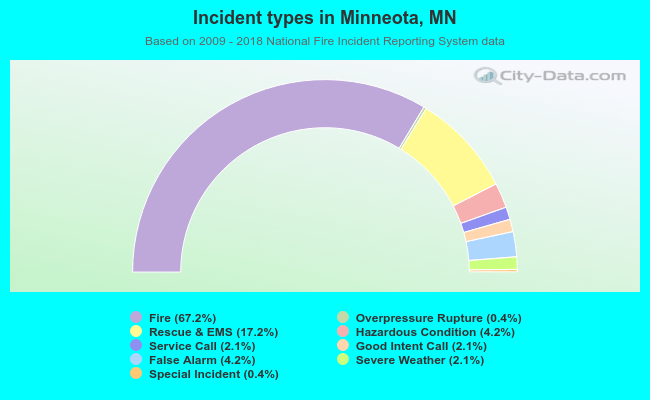 Out of all 238 cases reported during the years 2009 - 2018, the most belonged to the categories: Fire (67.2%), Rescue & EMS (17.2%), and Hazardous Condition (4.2%).
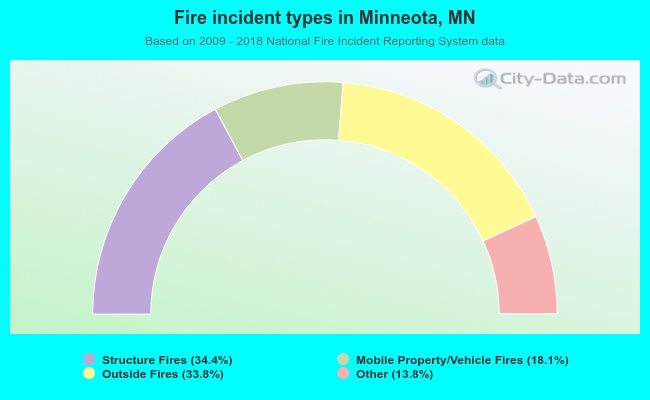 When looking into fire subcategories, the most incidents belonged to: Structure Fires (34.4%), and Outside Fires (33.8%).