Monmouth Junction: Fire Incidents, New Jersey (NJ)
Where are fire incidents reported in Monmouth Junction, NJ
Something went wrong! Please refresh the page.
|
| |||||||||||||||||||||||||||||||||||||||||||||||||||||||||||||||||||||||||||||||||||||||||||||||||||||||||||||
2002 - 2018 National Fire Incident Reporting System (NFIRS) incidents
- Incident types reported to NFIRS in Monmouth Junction, NJ
- 65830.7%Hazardous Condition
- 57826.9%Fire
- 57826.9%False Alarm
- 1597.4%Good Intent Call
- 934.3%Service Call
- 753.5%Rescue & EMS
- 30.1%Severe Weather
- Fire incident types reported to NFIRS in Monmouth Junction, NJ
- 23039.8%Structure Fires
- 21336.9%Outside Fires
- 11720.2%Mobile Property/Vehicle Fires
- 183.1%Other
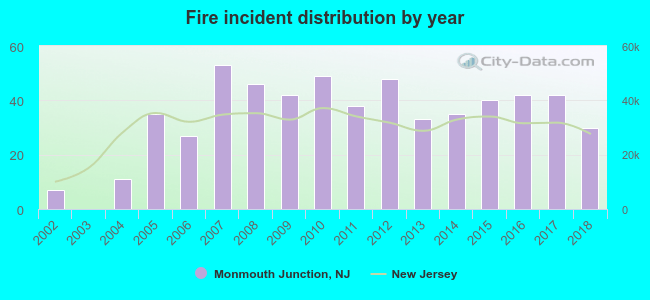 Based on the data from the years 2002 - 2018 the average number of fire incidents per year is 34. The highest number of fires - 53 took place in 2007, and the least - 0 in 2003. The data has a rising trend.
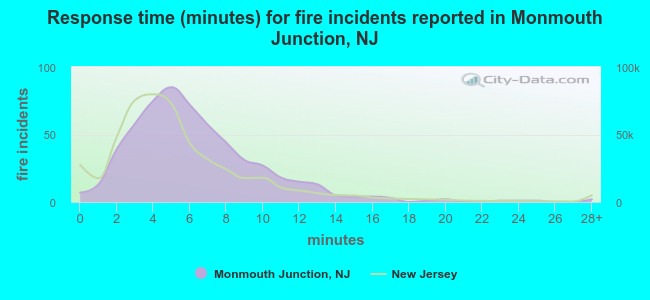 The median response time based on all reported fire incidents is 6 minutes. This is about the same as the New Jersey median value.
The median response time in Monmouth Junction, NJ compared to nearest cities:
(Note: Based on data for all years, including only cities with at least 500 fire incidents)
| Monmouth Junction: | 6 minutes |
| Cranbury: | 7 minutes |
| Princeton: | 8 minutes |
| Voorhees: | 6 minutes |
| East Brunswick: | 5 minutes |
| Somerset: | 8 minutes |
| New Brunswick: | 3 minutes |
| Highland Park: | 2 minutes |
| Old Bridge: | 4 minutes |
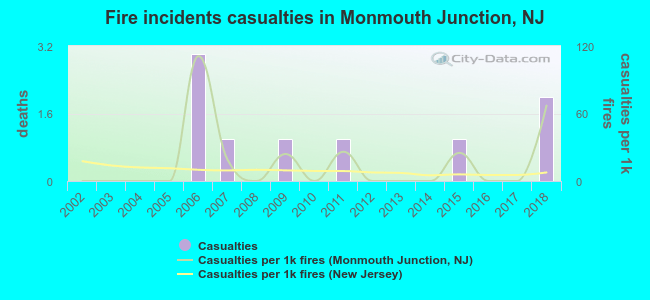 Based on the reports from the years 2002 - 2018 the average number of fire-related yearly casualties is 1. The highest number of reported injuries - 3 took place in 2006, and the lowest - 0 in 2002. The data has a growing trend.
The average number of injuries per 1,000 fires is 16. This indicator was the highest - 111 in 2006, and the lowest 0 in 2002. The trend for injuries per 1,000 fires is rising. Compared to the New Jersey value the number of injuries per 1,000 fires is higher.
Based on the reports from the years 2002 - 2018 the average number of fire-related yearly casualties is 1. The highest number of reported injuries - 3 took place in 2006, and the lowest - 0 in 2002. The data has a growing trend.
The average number of injuries per 1,000 fires is 16. This indicator was the highest - 111 in 2006, and the lowest 0 in 2002. The trend for injuries per 1,000 fires is rising. Compared to the New Jersey value the number of injuries per 1,000 fires is higher.Casualties per 1,000 incidents in Monmouth Junction, NJ compared to nearest cities:
(Note: Based on data for all years, including only cities with at least 500 fire incidents)
| Monmouth Junction: | 15.6 |
| Cranbury: | 0.0 |
| Princeton: | 9.0 |
| Voorhees: | 2.7 |
| East Brunswick: | 7.0 |
| Somerset: | 5.0 |
| New Brunswick: | 11.6 |
| Highland Park: | 7.3 |
| Old Bridge: | 9.9 |
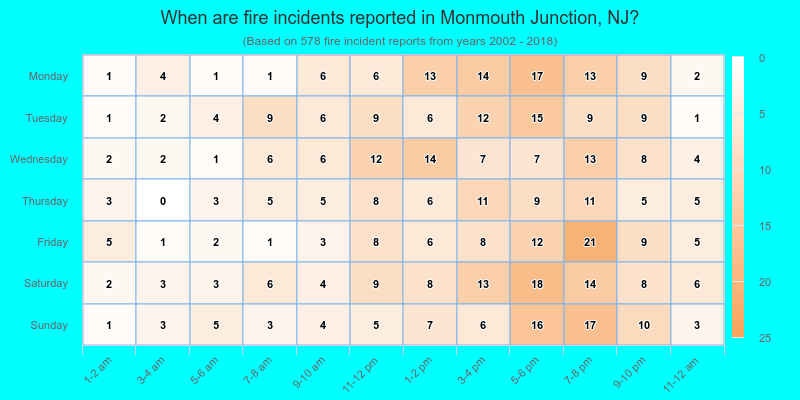
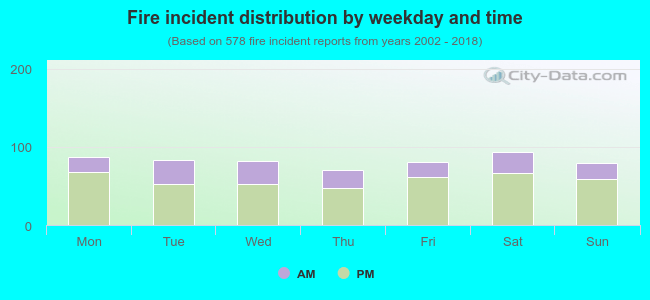 29.6% incidents where reported in the morning and 70.4% in the evening. The most fires (16.3%) took place on Saturday, and the least (12.3%) on Thursday.
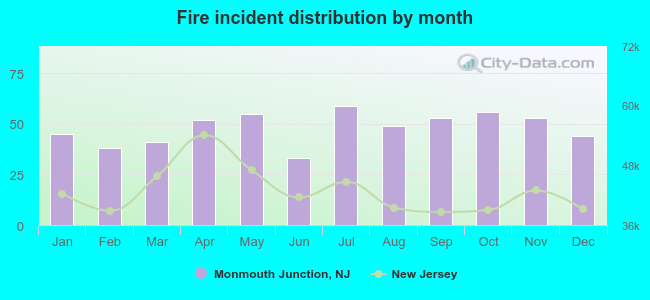 According to the 578 reports from years 2002 - 2018 most fires (10.2%) took place during July, and the least (5.7%) in June.
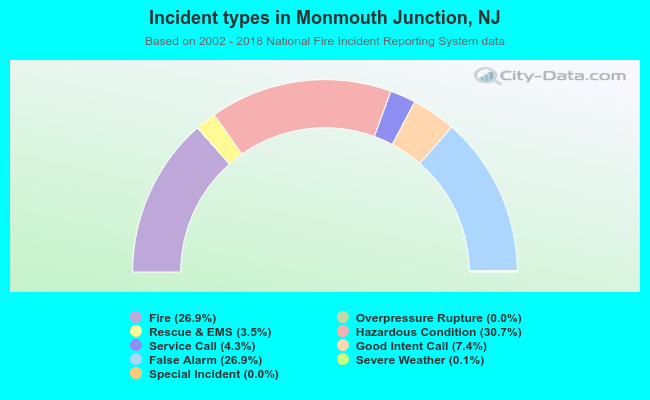 Out of all 2,146 cases reported during the years 2002 - 2018, the most belonged to the categories: Hazardous Condition (30.7%), Fire (26.9%), and False Alarm (26.9%).
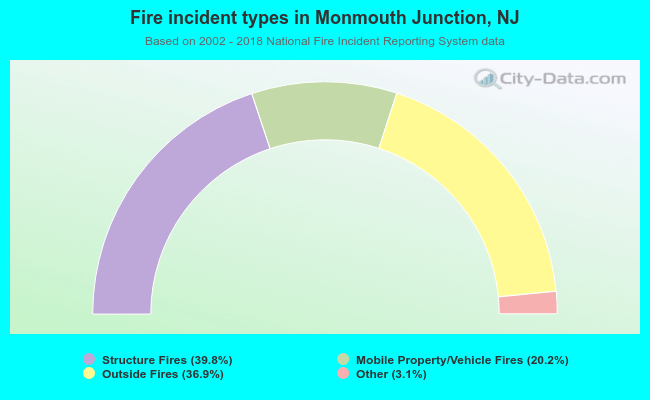 When looking into fire subcategories, the most reports belonged to: Structure Fires (39.8%), and Outside Fires (36.9%).