Montrose: Fire Incidents, Minnesota (MN)
Where are fire incidents reported in Montrose, MN
Something went wrong! Please refresh the page.
|
| |||||||||||||||||||||||||||||||||||||||||||||||||||||||||||||||||||||||||||||||||||||||||||||||||||||||||||||
2002 - 2018 National Fire Incident Reporting System (NFIRS) incidents
- Incident types reported to NFIRS in Montrose, MN
- 64555.6%Rescue & EMS
- 25522.0%Fire
- 12310.6%Hazardous Condition
- 494.2%Good Intent Call
- 322.8%Severe Weather
- 282.4%Service Call
- 272.3%False Alarm
- Fire incident types reported to NFIRS in Montrose, MN
- 12950.6%Structure Fires
- 8232.2%Outside Fires
- 3413.3%Mobile Property/Vehicle Fires
- 103.9%Other
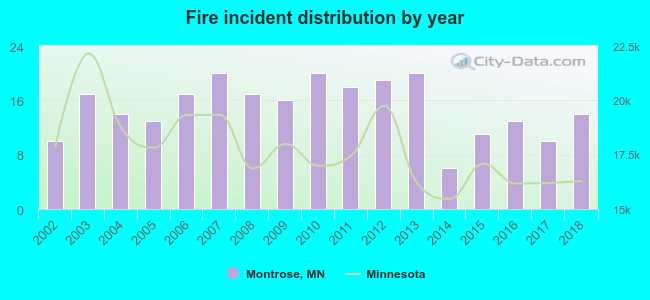 Based on the data from the years 2002 - 2018 the average number of fire incidents per year is 15. The highest number of fire incidents - 20 took place in 2007, and the least - 6 in 2014. The data has a rising trend.
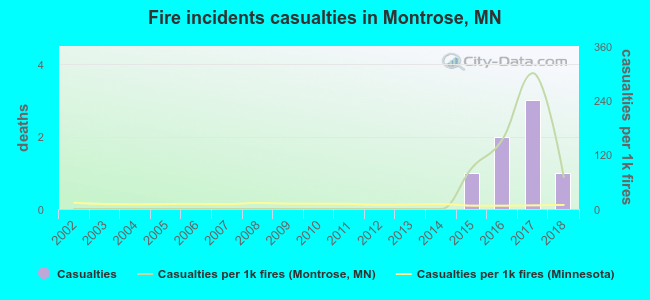 According to the data from the years 2002 - 2018 the average number of fire-related yearly casualties is 0. The highest number of reported injuries - 3 took place in 2017, and the lowest - 0 in 2002. The data has a rising trend.
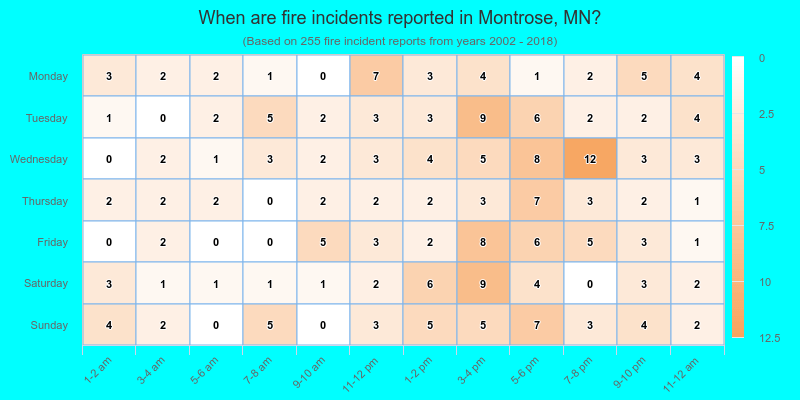
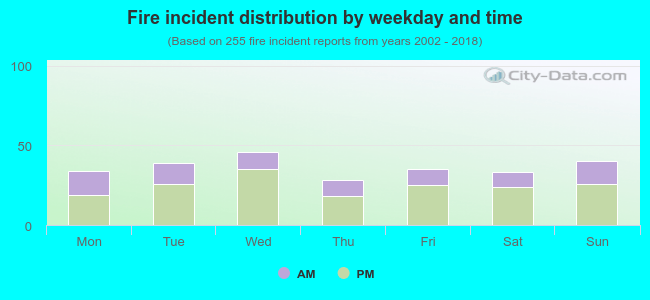 32.2% incidents where reported in the morning and 67.8% in the evening. The most fires (18.0%) took place on Wednesday, and the least (11.0%) on Thursday.
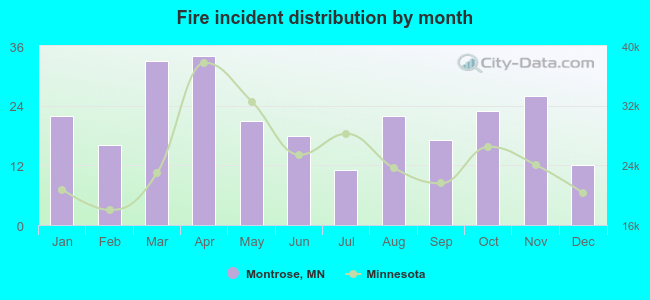 According to the 255 incident reports from years 2002 - 2018 most fires (13.3%) took place during April, and the least (4.3%) in July.
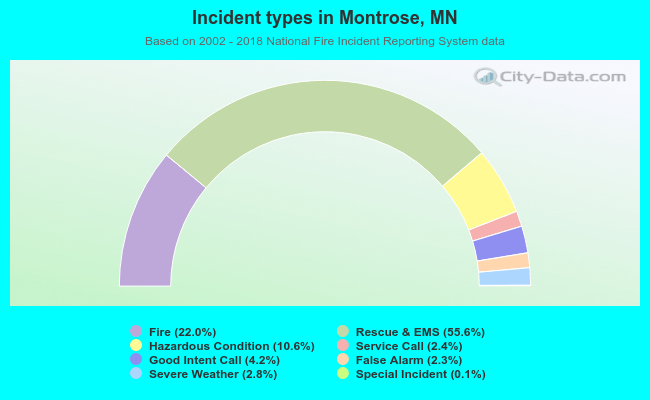 Out of all 1,160 cases reported during the years 2002 - 2018, the most belonged to the categories: Overpressure Rupture (55.6%), Fire (22.0%), and Rescue & EMS (10.6%).
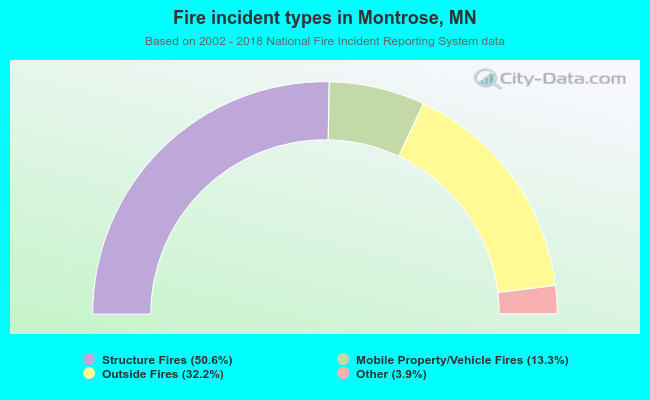 When looking into fire subcategories, the most incidents belonged to: Structure Fires (50.6%), and Outside Fires (32.2%).