Mooreland: Fire Incidents, Indiana (IN)
Where are fire incidents reported in Mooreland, IN
Something went wrong! Please refresh the page.
|
| |||||||||||||||||||||||||||||||||||||||||||||||||||||||||||||||||||||||||||||||||||||||||||||||||||||||||||||
2002 - 2017 National Fire Incident Reporting System (NFIRS) incidents
- Incident types reported to NFIRS in Mooreland, IN
- 14451.8%Fire
- 9032.4%Good Intent Call
- 248.6%Rescue & EMS
- 93.2%Hazardous Condition
- 62.2%Service Call
- 31.1%False Alarm
- 10.4%Overpressure Rupture
- 10.4%Special Incident
- Fire incident types reported to NFIRS in Mooreland, IN
- 7552.1%Structure Fires
- 5135.4%Outside Fires
- 149.7%Mobile Property/Vehicle Fires
- 42.8%Other
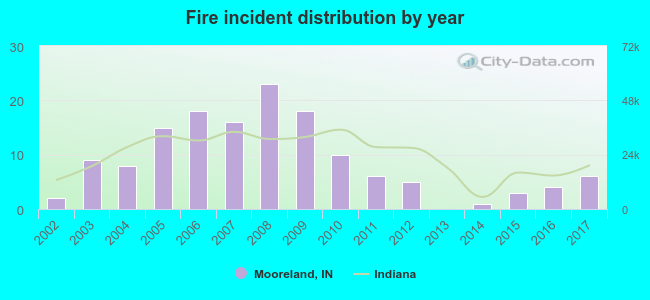 According to the data from the years 2002 - 2017 the average number of fire incidents per year is 9. The highest number of fire incidents - 23 took place in 2008, and the least - 0 in 2013. The data has a rising trend.
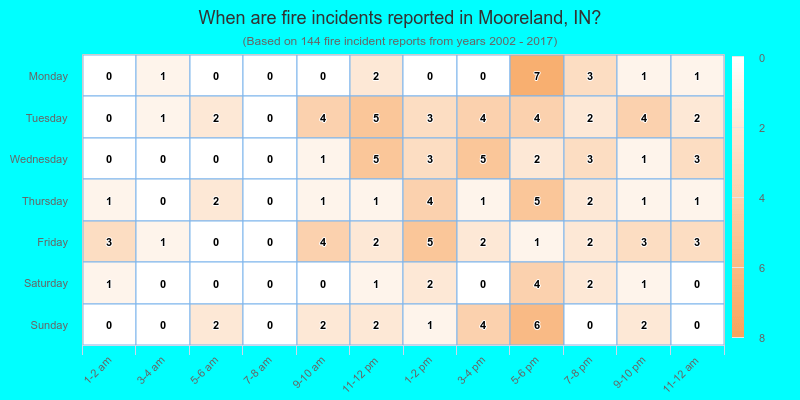
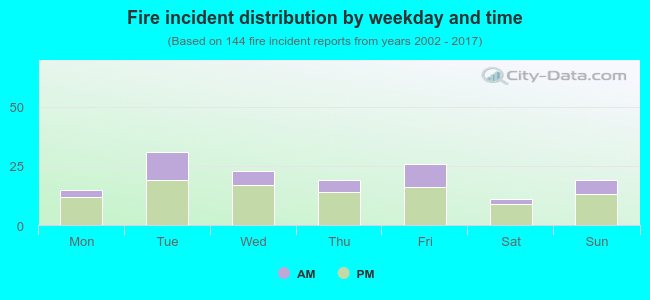 30.6% incidents where reported in the morning and 69.4% in the evening. The most fires (21.5%) took place on Tuesday, and the least (7.6%) on Saturday.
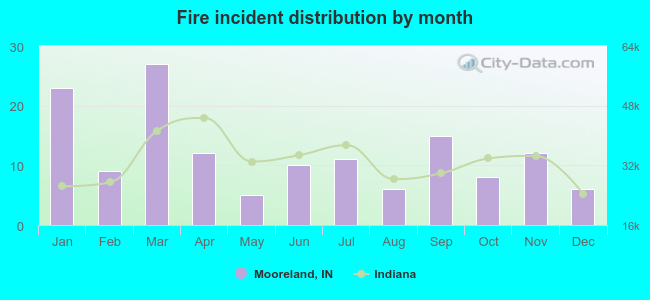 According to the 144 fires from years 2002 - 2017 most fires (18.8%) took place during March, and the least (3.5%) in May.
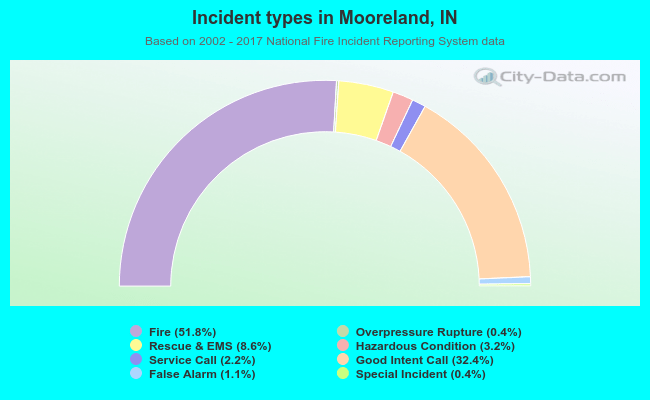 Out of all 278 cases reported during the years 2002 - 2017, the most belonged to the categories: Fire (51.8%), Good Intent Call (32.4%), and Rescue & EMS (8.6%).
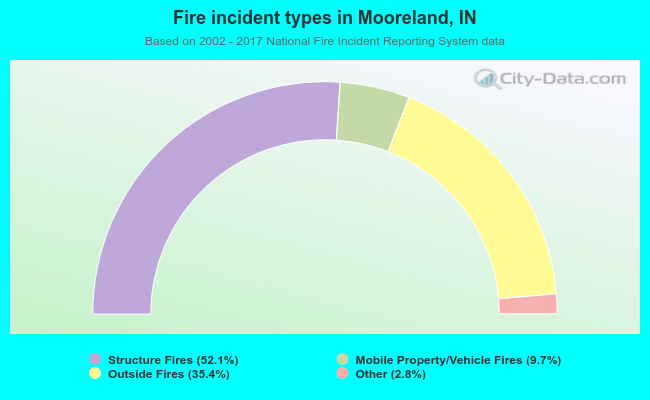 When looking into fire subcategories, the most incidents belonged to: Structure Fires (52.1%), and Outside Fires (35.4%).