| Fire incidents reported |
|---|
| Sreet name | Count |
|---|
| MORRAL KIRKPATRICK RD | 28 | | IRVIN SHOOTS RD | 22 | | HILLMANFORD RD | 20 | | MARSEILLES-GALION RD | 20 | | GREEN ST | 18 | | MARION UPPERSANDUSKY RD | 18 | | PLEASANT HILL RD | 18 | | HARDING HIGHWAY | 12 | | KENTON-GALION RD | 10 | | MARION-BUCYRUS RD | 10 | | PROSPECT-UPPER SANDUSKY RD | 10 | | U.S. 23 HWY | 10 | | EAST ST | 8 | | KENTONGALION RD | 8 | | MARSEILLESGALION RD | 8 | | OSBUN RD | 8 | | US 23 HWY | 8 | | BAER RD | 6 | | CO RD 113 | 6 | | MARION- WYANDOT LINE | 6 | | NEFF ST | 6 | | POWELL RD | 6 | | SCHELL DR | 6 | | STATE ROUTE 231 | 6 | | AGOSTA-MEEKER RD | 4 |
| | | Fire incidents reported |
|---|
| Sreet name | Count |
|---|
| BROWN ROAD | 4 | | GOODNOW RD | 4 | | HILLMAN FORD RD | 4 | | MARSEILLES GALION | 4 | | MORRALKIRKPATRICK RD | 4 | | OSBUN RD RD | 4 | | SOUTH ST | 4 | | STAUFFER RD | 4 | | WASHBURN RD | 4 | | WEISS AVE | 4 | | WILDCAT PIKE | 4 | | 136 IRVIN SHOOTS ROAD | 2 | | 154 S. GREEN ST. | 2 | | 19193 CH 126 | 2 | | 19193 TWP HWY 126 | 2 | | 199 GREEN ST. | 2 | | 342 S. GREEN | 2 | | 3741 MORRAL KIRKPATRICK | 2 | | 4882 W KENTON GALION RD | 2 | | 735 MORRAL KIRP RD | 2 | | 804 TR 68 | 2 | | BRUSHRIDGE-WYANDOT RD | 2 | | BRUSHRIDGEWYANDOT RD | 2 | | BUMFORD RD | 2 | | |
|
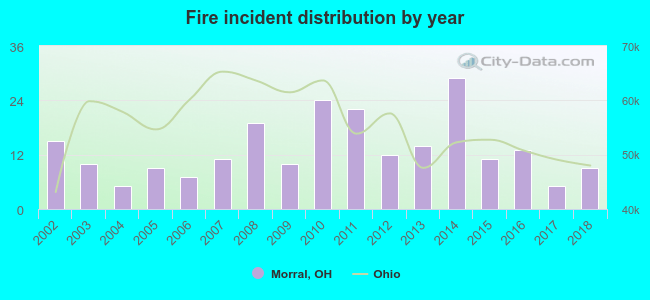 Based on the data from the years 2002 - 2018 the average number of fires per year is 13. The highest number of reported fire incidents - 29 took place in 2014, and the least - 5 in 2004. The data has a decreasing trend.
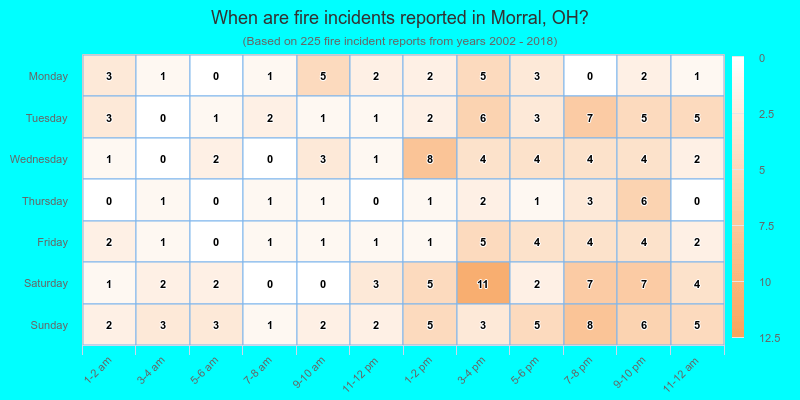
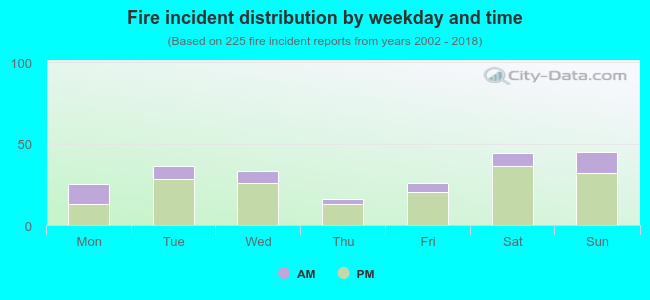 25.3% incidents where reported in the morning and 74.7% in the evening. The most fires (20.0%) took place on Sunday, and the least (7.1%) on Thursday.
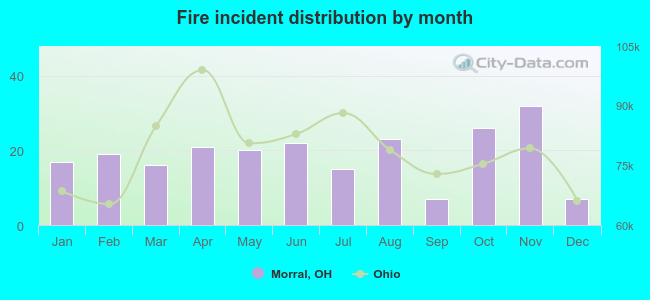 According to the 225 incident reports from years 2002 - 2018 most fires (14.2%) took place during November, and the least (3.1%) in September.
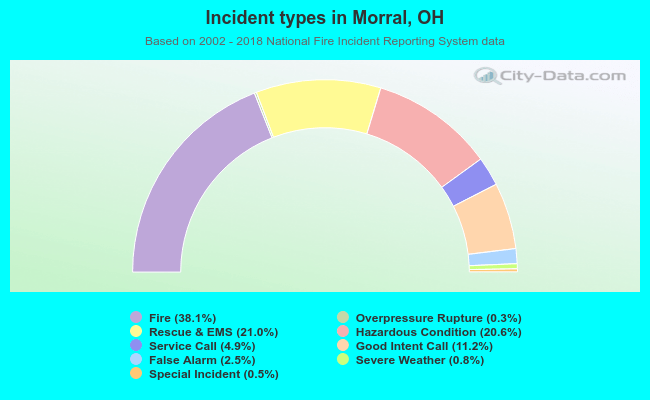 Out of all 591 cases reported during the years 2002 - 2018, the most belonged to the categories: Fire (38.1%), Rescue & EMS (21.0%), and Hazardous Condition (20.6%).
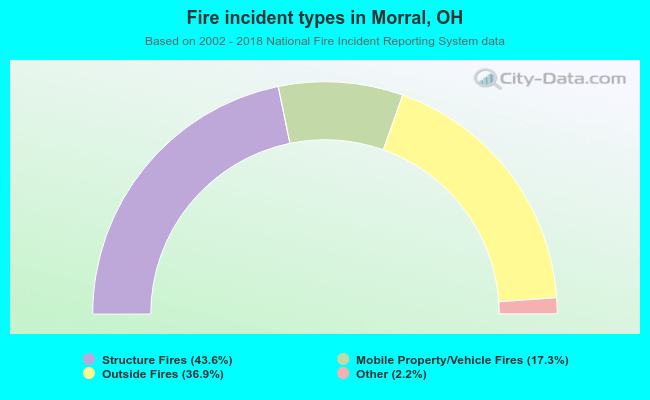 When looking into fire subcategories, the most reports belonged to: Structure Fires (43.6%), and Outside Fires (36.9%).