Mount Vernon: Fire Incidents, Indiana (IN)
Where are fire incidents reported in Mount Vernon, IN
Something went wrong! Please refresh the page.
|
| |||||||||||||||||||||||||||||||||||||||||||||||||||||||||||||||||||||||||||||||||||||||||||||||||||||||||||||
| Other | 43 | |||||||||||||||||||||||||||||||||||||||||||||||||||||||||||||||||||||||||||||||||||||||||||||||||||||||||||||
2007 - 2018 National Fire Incident Reporting System (NFIRS) incidents
- Incident types reported to NFIRS in Mount Vernon, IN
- 1,59060.1%Rescue & EMS
- 39715.0%Fire
- 29111.0%Hazardous Condition
- 2087.9%Good Intent Call
- 793.0%False Alarm
- 732.8%Service Call
- 50.2%Special Incident
- 30.1%Overpressure Rupture
- Fire incident types reported to NFIRS in Mount Vernon, IN
- 17945.1%Outside Fires
- 12331.0%Structure Fires
- 5614.1%Mobile Property/Vehicle Fires
- 399.8%Other
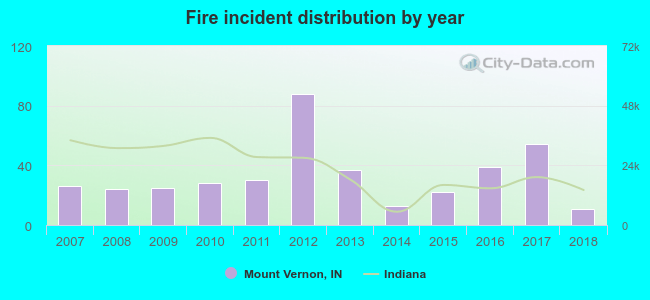 Based on the data from the years 2007 - 2018 the average number of fire incidents per year is 33. The highest number of fires - 88 took place in 2012, and the least - 11 in 2018. The data has a dropping trend.
The average number of yearly fire incidents per 10k residents in Mount Vernon, IN compared to nearest cities:
(Note: Based on data for the last 3 years, including only cities with population 5,000 and above)
| Mount Vernon: | 52.7 |
| Evansville: | 3.3 |
| Princeton: | 8.7 |
| Boonville: | 37.9 |
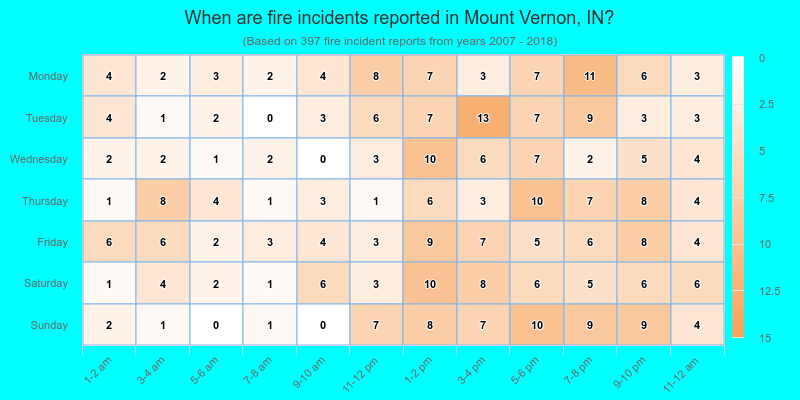
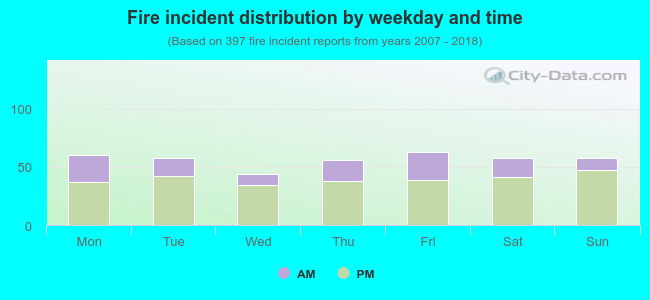 30.0% incidents where reported in the morning and 70.0% in the evening. The most fires (15.9%) took place on Friday, and the least (11.1%) on Wednesday.
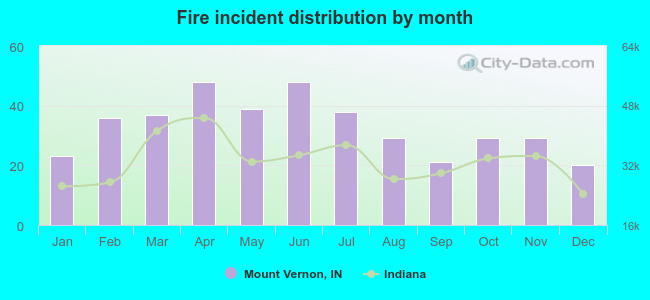 According to the 397 fire incidents from years 2007 - 2018 most fires (12.1%) took place during April, and the least (5.0%) in December.
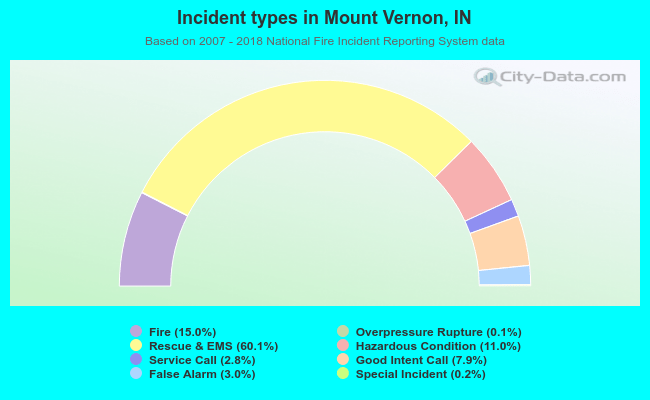 Out of all 2,646 cases reported during the years 2007 - 2018, the most belonged to the categories: Rescue & EMS (60.1%), Fire (15.0%), and Hazardous Condition (11.0%).
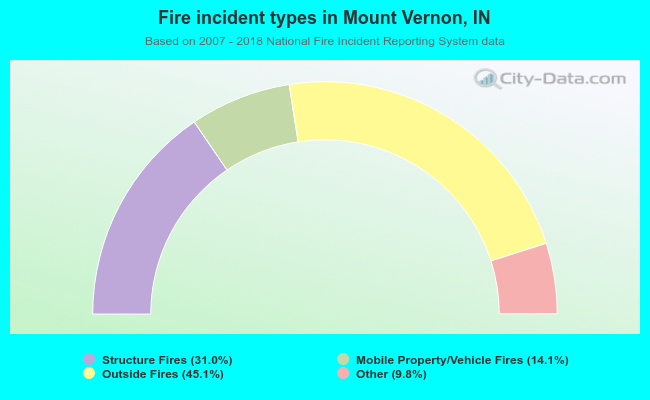 When looking into fire subcategories, the most reports belonged to: Outside Fires (45.1%), and Structure Fires (31.0%).