Nags Head: Fire Incidents, North Carolina (NC)
Where are fire incidents reported in Nags Head, NC
Something went wrong! Please refresh the page.
| Fire incidents reported | |
|---|---|
| Sreet name | Count |
| S VIRGINIA DARE TRL | 250 |
| S CROATAN HWY | 170 |
| VIRGINIA DARE TRL | 156 |
| CROATAN HWY | 148 |
| S OLD OREGON INLET RD | 98 |
| OLD OREGON INLET RD | 74 |
| S MEMORIAL AVE | 20 |
| S LINKS DR | 16 |
| S CROATAN HWY | 14 |
| HEALTH CENTER DR | 12 |
| NC 12 | 12 |
| VA DARE TRL | 12 |
| W OAK KNOLL DR | 12 |
| WRIGHTSVILLE AVE | 12 |
| COLONY SOUTH DR | 10 |
| MEMORIAL AVE | 10 |
| OAK KNOLL DR | 10 |
| S LINDA LN | 10 |
| BALTIC ST | 8 |
| BUCCANEER DR | 8 |
| E ENTERPRISE ST | 8 |
| OLD NAGS HEAD WOODS RD | 8 |
| ONETO LN | 8 |
| S COLONY SOUTH DR | 8 |
| SOUNDSIDE RD | 8 |
| VILLA DUNES DR | 8 |
| W VANSCIVER DR | 8 |
| W VILLA DUNES DR | 8 |
| BLUE MARLIN WAY | 6 |
| CAROLISTA DR | 6 |
2002 - 2018 National Fire Incident Reporting System (NFIRS) incidents
- Incident types reported to NFIRS in Nags Head, NC
- 2,48336.4%Rescue & EMS
- 1,22217.9%Hazardous Condition
- 86012.6%Good Intent Call
- 82812.1%Fire
- 73210.7%False Alarm
- 6619.7%Service Call
- 290.4%Severe Weather
- Fire incident types reported to NFIRS in Nags Head, NC
- 40048.3%Structure Fires
- 32839.6%Outside Fires
- 657.9%Mobile Property/Vehicle Fires
- 354.2%Other
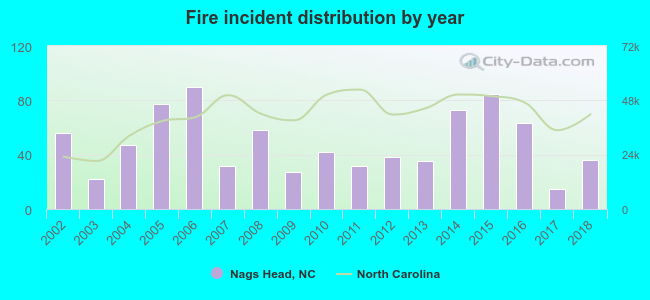 According to the data from the years 2002 - 2018 the average number of fires per year is 49. The highest number of fires - 90 took place in 2006, and the least - 15 in 2017. The data has a decreasing trend.
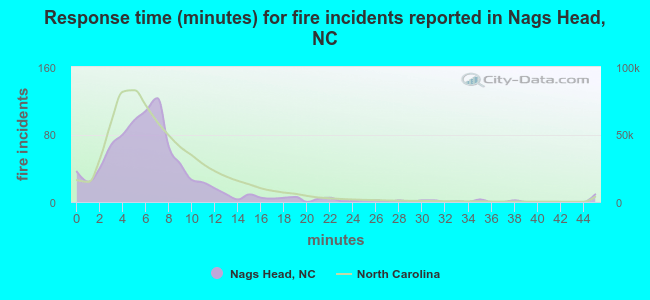 The median response time based on all reported fire incidents is 6 minutes. This is close to the North Carolina median value.
The median response time in Nags Head, NC compared to nearest cities:
(Note: Based on data for all years, including only cities with at least 500 fire incidents)
| Nags Head: | 6 minutes |
| Kill Devil Hills: | 5 minutes |
| Kitty Hawk: | 6 minutes |
| Elizabeth City: | 5 minutes |
| Hertford: | 11 minutes |
| Edenton: | 6 minutes |
| Plymouth: | 7 minutes |
| Ahoskie: | 6 minutes |
| Williamston: | 5 minutes |
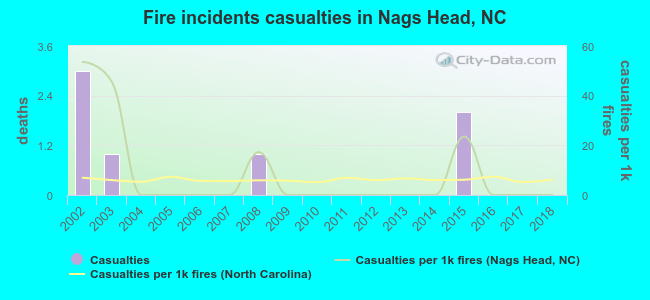 Based on the reports from the years 2002 - 2018 the average number of fire-related yearly casualties is 0. The highest number of reported casualties - 3 took place in 2002, and the lowest - 0 in 2004. The data has a declining trend.
The average number of injuries per 1,000 fires is 8. This indicator was the highest - 54 in 2002, and the lowest 0 in 2004. The trend for injuries per 1,000 fires is decreasing. Compared to the North Carolina value the number of injuries per 1,000 fire incidents is higher.
Based on the reports from the years 2002 - 2018 the average number of fire-related yearly casualties is 0. The highest number of reported casualties - 3 took place in 2002, and the lowest - 0 in 2004. The data has a declining trend.
The average number of injuries per 1,000 fires is 8. This indicator was the highest - 54 in 2002, and the lowest 0 in 2004. The trend for injuries per 1,000 fires is decreasing. Compared to the North Carolina value the number of injuries per 1,000 fire incidents is higher.Casualties per 1,000 incidents in Nags Head, NC compared to nearest cities:
(Note: Based on data for all years, including only cities with at least 500 fire incidents)
| Nags Head: | 8.5 |
| Kill Devil Hills: | 9.3 |
| Kitty Hawk: | 0.0 |
| Elizabeth City: | 7.3 |
| Hertford: | 1.2 |
| Edenton: | 4.4 |
| Plymouth: | 0.0 |
| Ahoskie: | 15.9 |
| Williamston: | 13.8 |
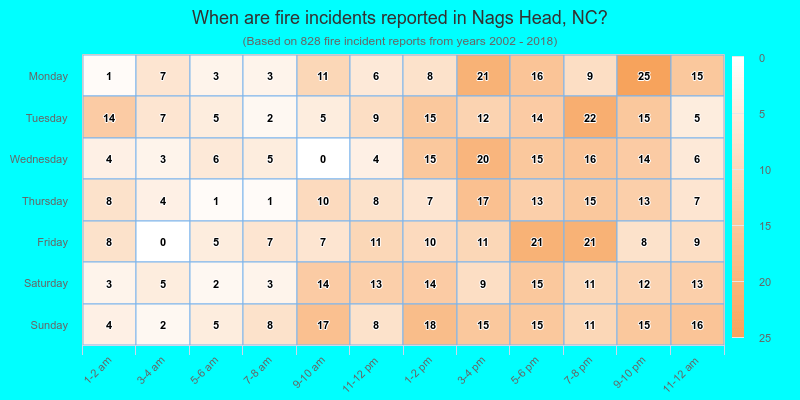
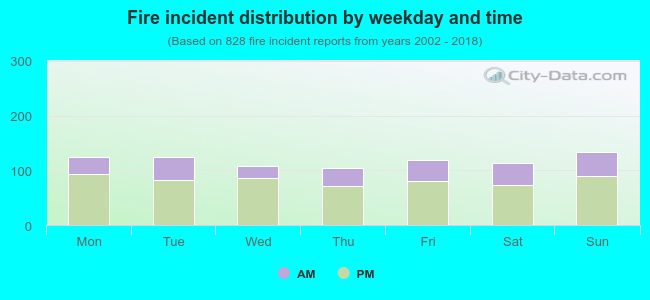 30.1% incidents where reported in the morning and 69.9% in the evening. The most fires (16.2%) took place on Sunday, and the least (12.6%) on Thursday.
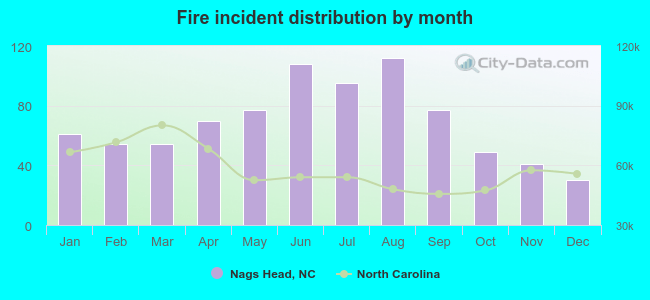 According to the 828 fires from years 2002 - 2018 most fires (13.5%) took place during August, and the least (3.6%) in December.
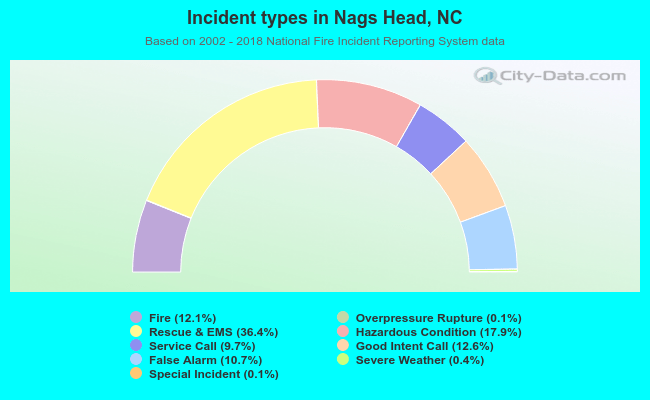 Out of all 6,825 cases reported during the years 2002 - 2018, the most belonged to the categories: Rescue & EMS (36.4%), Hazardous Condition (17.9%), and Good Intent Call (12.6%).
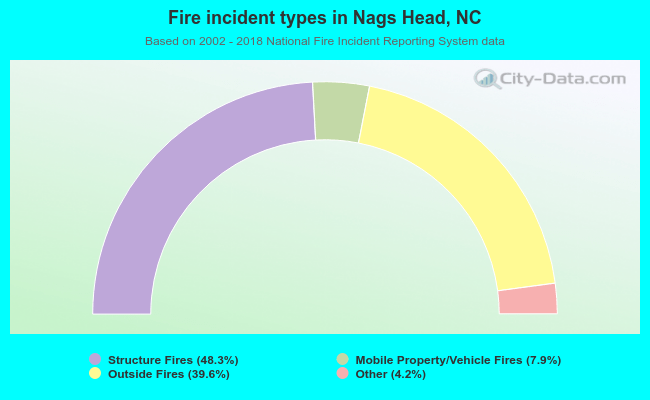 When looking into fire subcategories, the most incidents belonged to: Structure Fires (48.3%), and Outside Fires (39.6%).