New Canaan: Fire Incidents, Connecticut (CT)
Where are fire incidents reported in New Canaan, CT
Something went wrong! Please refresh the page.
| Fire incidents reported | |
|---|---|
| Sreet name | Count |
| MAIN ST | 64 |
| SOUTH AVE | 54 |
| MERRIT PARKWAY | 44 |
| OENOKE RIDGE RD | 40 |
| SILVERMINE RD | 40 |
| WEED ST | 40 |
| VALLEY RD | 32 |
| ELM ST | 26 |
| SMITH RIDGE RD | 26 |
| FOREST ST | 24 |
| WEST RD | 24 |
| OLD STAMFORD RD | 22 |
| PONUS RIDGE RD | 20 |
| LAKEVIEW AVE | 18 |
| MAPLE ST | 18 |
| NEW NORWALK RD | 18 |
| WHITE OAK SHADE RD | 18 |
| EAST AVE | 16 |
| MERRITT PARKWAY | 16 |
| PINE ST | 16 |
| BALD HILL RD | 14 |
| FROGTOWN RD | 14 |
| MILL RD | 14 |
| OLD NORWALK RD | 14 |
| SOUTH AVENUE | 14 |
| SUMMER ST | 14 |
| CARTER ST | 12 |
| COUNTRY CLUB RD | 12 |
| HERITAGE HILL RD | 12 |
| LOCUST AVE | 12 |
| Other | 168 |
2003 - 2018 National Fire Incident Reporting System (NFIRS) incidents
- Incident types reported to NFIRS in New Canaan, CT
- 2,45734.7%Hazardous Condition
- 1,46920.7%False Alarm
- 1,07415.2%Service Call
- 87612.4%Fire
- 6228.8%Good Intent Call
- 5668.0%Rescue & EMS
- Fire incident types reported to NFIRS in New Canaan, CT
- 54462.1%Structure Fires
- 20523.4%Outside Fires
- 10311.8%Mobile Property/Vehicle Fires
- 242.7%Other
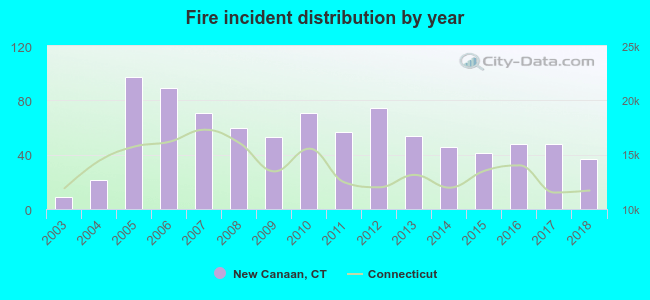 Based on the data from the years 2003 - 2018 the average number of fire incidents per year is 55. The highest number of reported fire incidents - 97 took place in 2005, and the least - 9 in 2003. The data has a rising trend.
The average number of yearly fire incidents per 10k residents in New Canaan, CT compared to nearest cities:
(Note: Based on data for the last 3 years, including only cities with population 5,000 and above)
| New Canaan: | 22.5 |
| Wilton: | 24.5 |
| Norwalk: | 29.7 |
| Darien: | 23.6 |
| Stamford: | 24.3 |
| Westport: | 32.1 |
| Weston: | 20.6 |
| Ridgefield: | 34.0 |
| Old Greenwich: | 4.0 |
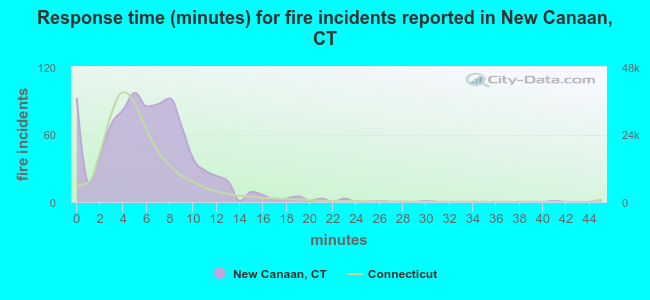 The median response time based on all reported fire incidents is 6 minutes. This is similar to the state median value.
The median response time in New Canaan, CT compared to nearest cities:
(Note: Based on data for all years, including only cities with at least 500 fire incidents)
| New Canaan: | 6 minutes |
| Wilton: | 6 minutes |
| Norwalk: | 6 minutes |
| Darien: | 7 minutes |
| Stamford: | 4 minutes |
| Westport: | 5 minutes |
| Weston: | 6 minutes |
| Ridgefield: | 6 minutes |
| Greenwich: | 5 minutes |
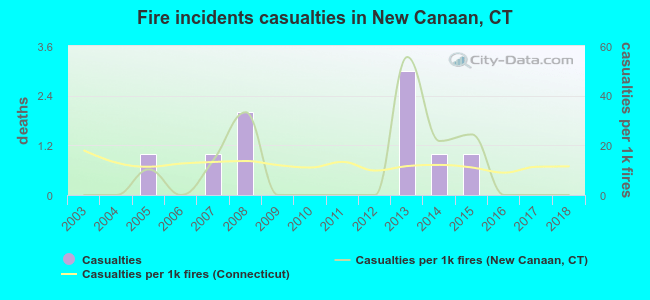 Based on the data from the years 2003 - 2018 the average number of fire-related casualties per year is 1. The highest number of reported injuries - 3 took place in 2013, and the lowest - 0 in 2003. The data has a constant trend.
The average number of casualties per 1,000 fires is 10. This indicator was the highest - 56 in 2013, and the lowest 0 in 2003. The trend for injuries per 1,000 fires is constant. Compared to the state value the number of casualties per 1,000 fires is about the same.
Based on the data from the years 2003 - 2018 the average number of fire-related casualties per year is 1. The highest number of reported injuries - 3 took place in 2013, and the lowest - 0 in 2003. The data has a constant trend.
The average number of casualties per 1,000 fires is 10. This indicator was the highest - 56 in 2013, and the lowest 0 in 2003. The trend for injuries per 1,000 fires is constant. Compared to the state value the number of casualties per 1,000 fires is about the same.
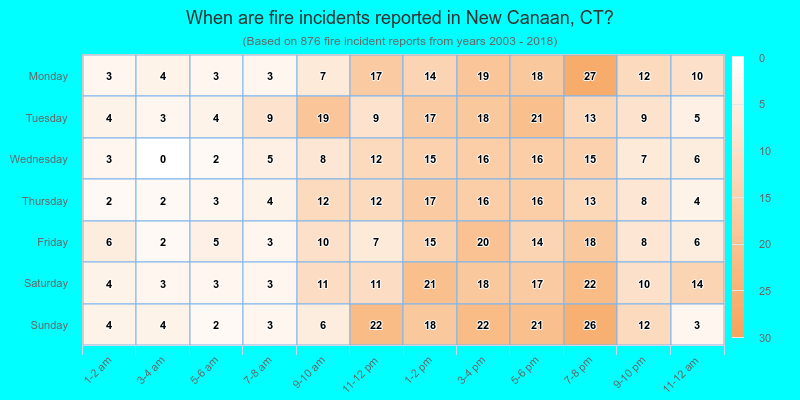
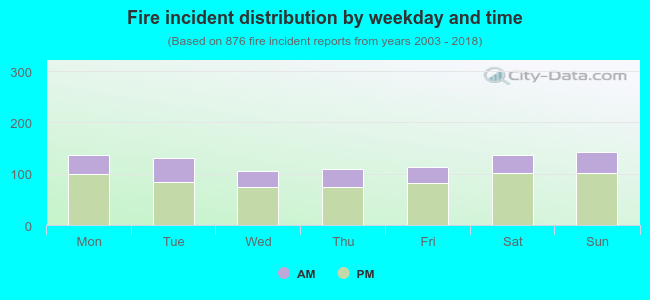 29.6% incidents where reported in the morning and 70.4% in the evening. The most fires (16.3%) took place on Sunday, and the least (12.0%) on Wednesday.
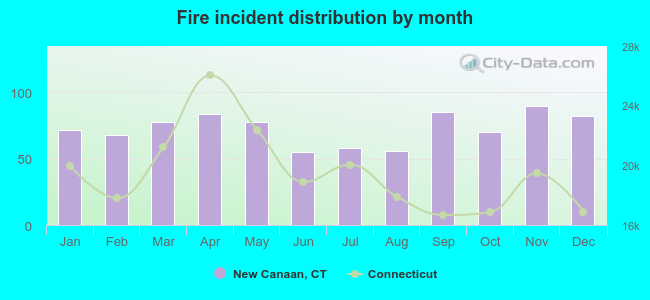 According to the 876 fire incident reports from years 2003 - 2018 most fires (10.3%) took place during November, and the least (6.3%) in June.
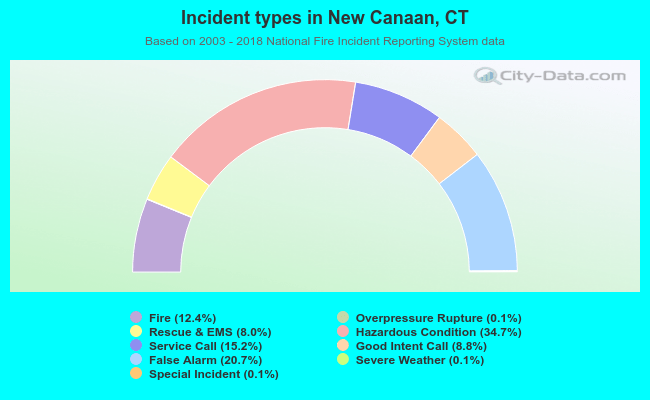 Out of all 7,082 cases reported during the years 2003 - 2018, the most belonged to the categories: Hazardous Condition (34.7%), False Alarm (20.7%), and Service Call (15.2%).
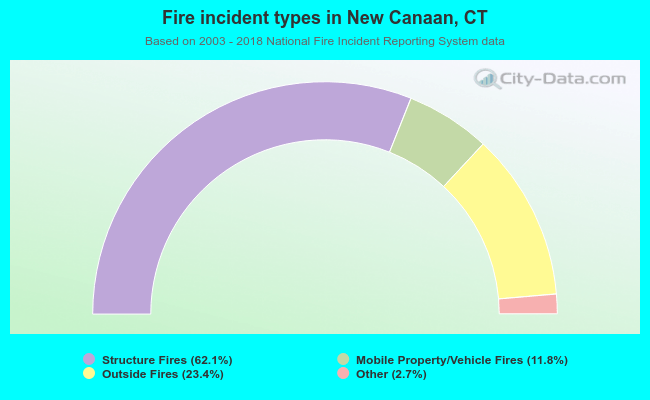 When looking into fire subcategories, the most incidents belonged to: Structure Fires (62.1%), and Outside Fires (23.4%).