New Lebanon: Fire Incidents, New York (NY)
Where are fire incidents reported in New Lebanon, NY
Something went wrong! Please refresh the page.
|
| |||||||||||||||||||||||||||||||||||||||||||||||||||||||||||||||||||||||||||||||||||||||||||||||||||||||||||||
2003 - 2018 National Fire Incident Reporting System (NFIRS) incidents
- Incident types reported to NFIRS in New Lebanon, NY
- 29532.1%Fire
- 28330.8%Hazardous Condition
- 12813.9%False Alarm
- 768.3%Good Intent Call
- 677.3%Rescue & EMS
- 606.5%Service Call
- 60.7%Severe Weather
- 30.3%Overpressure Rupture
- Fire incident types reported to NFIRS in New Lebanon, NY
- 17760.0%Structure Fires
- 9331.5%Outside Fires
- 155.1%Mobile Property/Vehicle Fires
- 103.4%Other
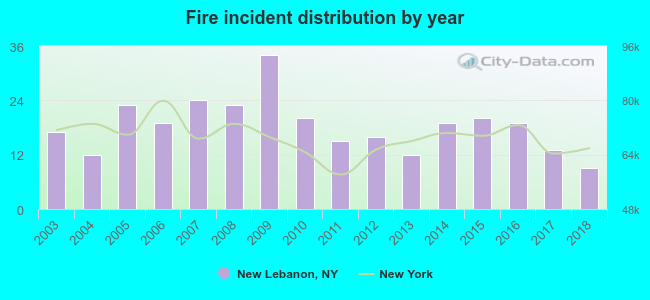 According to the data from the years 2003 - 2018 the average number of fire incidents per year is 18. The highest number of reported fire incidents - 34 took place in 2009, and the least - 9 in 2018. The data has a dropping trend.
 According to the reports from the years 2003 - 2018 the average number of fire-related yearly casualties is 0. The highest number of injuries - 1 took place in 2011, and the lowest - 0 in 2003. The data has a constant trend.
 33.9% incidents where reported in the morning and 66.1% in the evening. The most fires (17.6%) took place on Monday, and the least (10.8%) on Wednesday.
 Based on the 295 fire incidents from years 2003 - 2018 most fires (21.4%) took place during April, and the least (1.4%) in September.
 Out of all 918 cases reported during the years 2003 - 2018, the most belonged to the categories: Fire (32.1%), Hazardous Condition (30.8%), and False Alarm (13.9%).
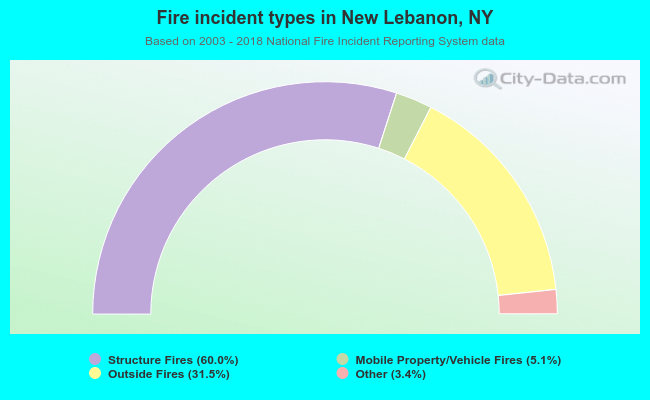 When looking into fire subcategories, the most incidents belonged to: Structure Fires (60.0%), and Outside Fires (31.5%).