| Fire incidents reported |
|---|
| Sreet name | Count |
|---|
| I-55 | 22 | | HWY 61 | 10 | | HWY 61 NORTH | 10 | | BLOOMFIELD RD | 8 | | HWY 61 SOUTH | 8 | | STATE HWY WW | 6 | | 376 STATE HWY U | 4 | | 610 DAVIS ST. | 4 | | 700 SCOTT STREET | 4 | | BEVERLY DR. | 4 | | BLADES DR. | 4 | | BLOOMFIELD RD. | 4 | | BRUSH PARARIE | 4 | | COUNTY RD 725 | 4 | | HWY AA | 4 | | I 55 44 MM | 4 | | I 55 47 MM | 4 | | I-55 @ 44MM | 4 | | LEVEE RD | 4 | | LEVEE RD. | 4 | | LEVEE ROAD | 4 | | LEVEE SOUTH OF NEW MADRID | 4 | | OBANNON PARK | 4 | | OLD KINGSHIGHWAY | 4 | | PINNELL & BRUSH PRAIRIE | 4 |
| | | Fire incidents reported |
|---|
| Sreet name | Count |
|---|
| RT W | 4 | | RUSSELL ST | 4 | | "AA" HWY | 2 | | #1 COURT HOUSE SQUARE | 2 | | #30 COUNTY ROAD 829 | 2 | | #35 EDWARDS DR. | 2 | | 101 RIVERSIDE DR | 2 | | 1011 DAVIS | 2 | | 1011 DAVIS ST. | 2 | | 1035 MOTT ST. | 2 | | 1035 MOTT STREET | 2 | | 10416 US HWY 61 | 2 | | 1050 DAVIS ST. | 2 | | 110 ST MATTHEWS | 2 | | 110 ST. MATTHEWS | 2 | | 11426 US HWY 61 | 2 | | 1192 COUNTY RD 708 | 2 | | 1192 CTY RD 708 | 2 | | 1212 SCOTT ST | 2 | | 1218 DAVIS ST. | 2 | | 1281 MILL ST | 2 | | 1325 MILL STREET | 2 | | 1423 DAVIS STREET | 2 | | 1443 ST HWY P | 2 | | |
|
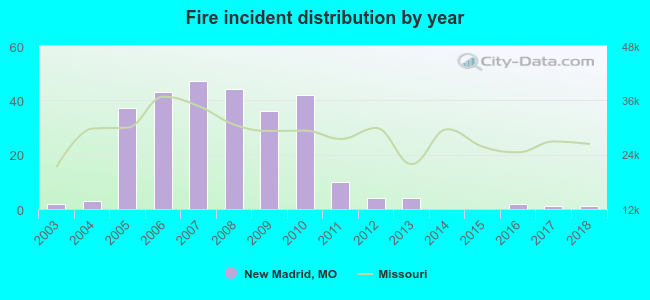 According to the data from the years 2003 - 2018 the average number of fire incidents per year is 17. The highest number of fires - 47 took place in 2007, and the least - 0 in 2014. The data has a declining trend.
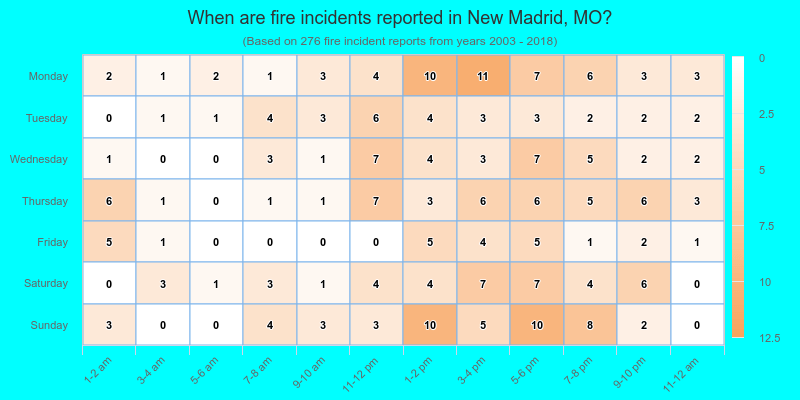
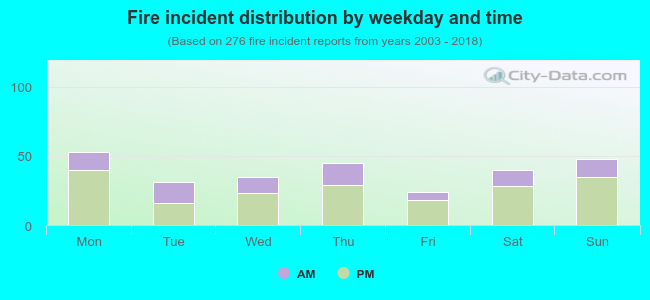 31.5% incidents where reported in the morning and 68.5% in the evening. The most fires (19.2%) took place on Monday, and the least (8.7%) on Friday.
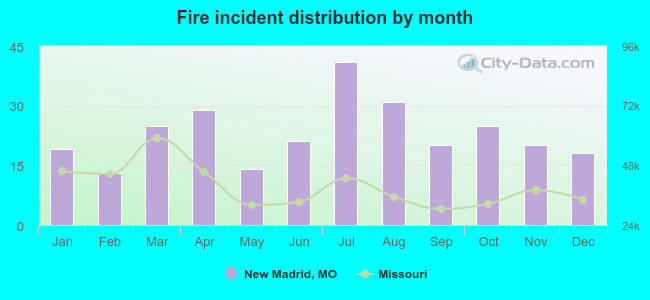 According to the 276 fire incident reports from years 2003 - 2018 most fires (14.9%) took place during July, and the least (4.7%) in February.
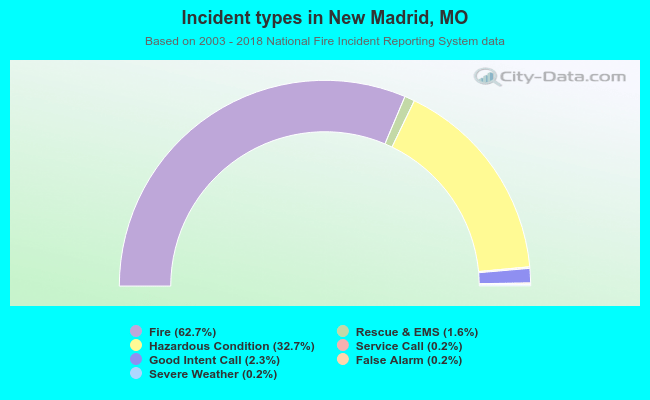 Out of all 440 cases reported during the years 2003 - 2018, the most belonged to the categories: Fire (62.7%), Rescue & EMS (32.7%), and Service Call (2.3%).
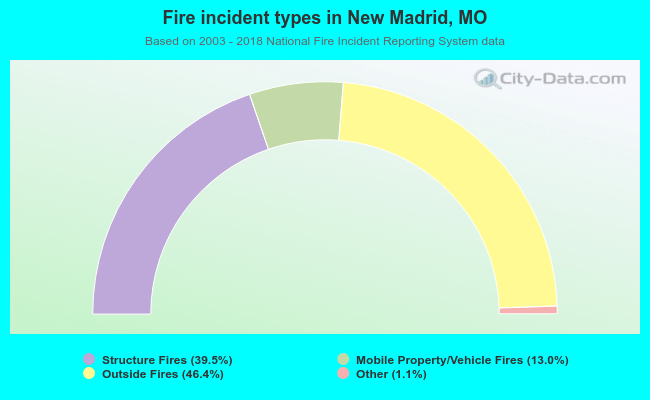 When looking into fire subcategories, the most incidents belonged to: Outside Fires (46.4%), and Structure Fires (39.5%).