New Richland: Fire Incidents, Minnesota (MN)
Where are fire incidents reported in New Richland, MN
Something went wrong! Please refresh the page.
|
| |||||||||||||||||||||||||||||||||||||||||||||||||||||||||||||||||||||||||||||||||||||||||||||||||||||||||||||
2002 - 2018 National Fire Incident Reporting System (NFIRS) incidents
- Incident types reported to NFIRS in New Richland, MN
- 16139.1%Fire
- 16139.1%Rescue & EMS
- 4611.2%Hazardous Condition
- 235.6%False Alarm
- 143.4%Good Intent Call
- 30.7%Overpressure Rupture
- 30.7%Service Call
- 10.2%Severe Weather
- Fire incident types reported to NFIRS in New Richland, MN
- 7747.8%Structure Fires
- 4930.4%Outside Fires
- 2314.3%Mobile Property/Vehicle Fires
- 127.5%Other
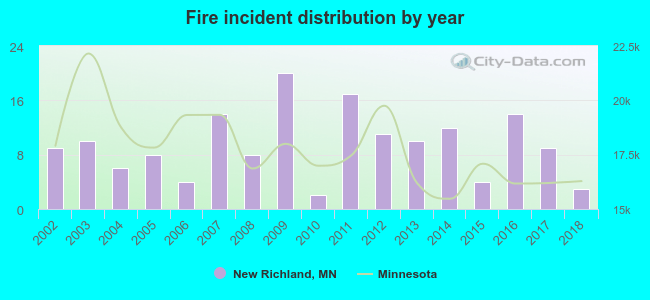 Based on the data from the years 2002 - 2018 the average number of fire incidents per year is 9. The highest number of reported fire incidents - 20 took place in 2009, and the least - 2 in 2010. The data has a dropping trend.
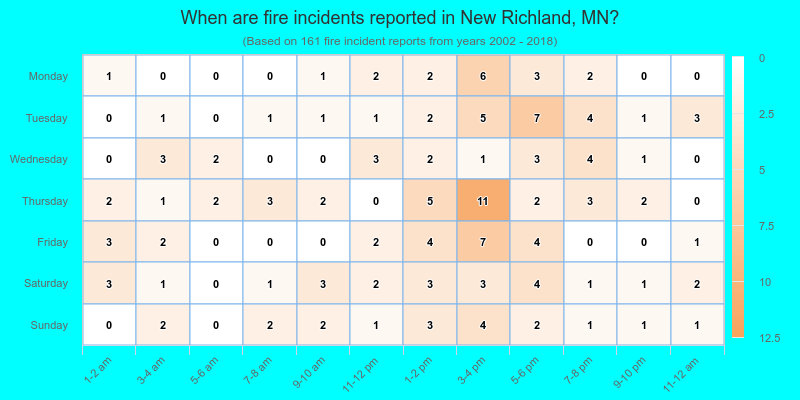
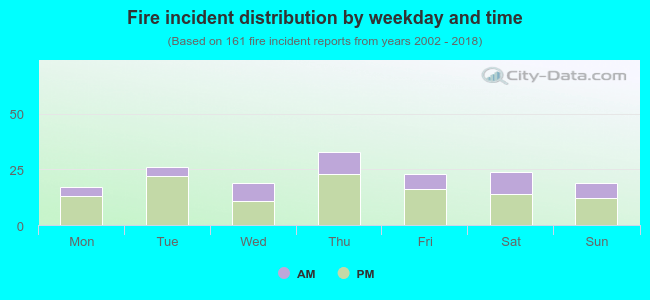 31.1% incidents where reported in the morning and 68.9% in the evening. The most fires (20.5%) took place on Thursday, and the least (10.6%) on Monday.
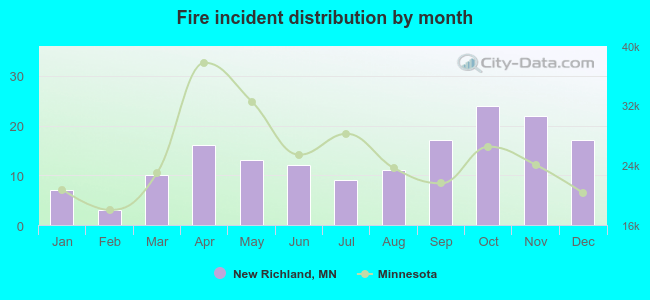 According to the 161 fires from years 2002 - 2018 most fires (14.9%) took place during October, and the least (1.9%) in February.
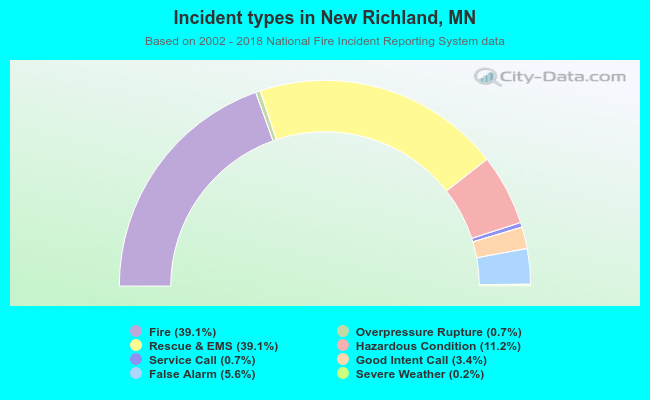 Out of all 412 cases reported during the years 2002 - 2018, the most belonged to the categories: Fire (39.1%), Rescue & EMS (39.1%), and Hazardous Condition (11.2%).
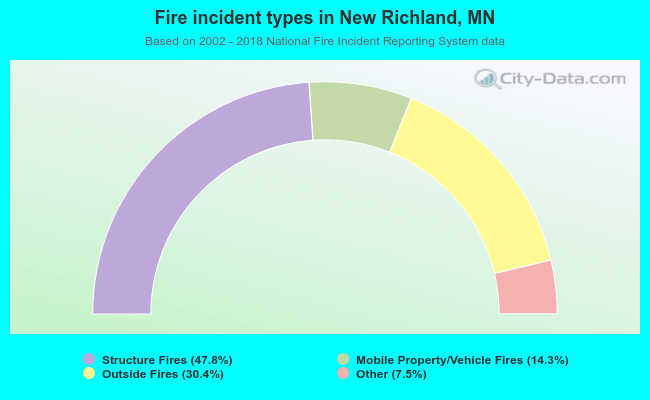 When looking into fire subcategories, the most reports belonged to: Structure Fires (47.8%), and Outside Fires (30.4%).