| Fire incidents reported |
|---|
| Sreet name | Count |
|---|
| PINEY HOLLOW ROAD RD | 34 | | CATAWBA AVE | 22 | | HARDING HIGHWAY HWY | 22 | | LAKE ROAD RD | 18 | | DUTCH MILL ROAD RD | 16 | | CATAWBA AVENUE AVE | 12 | | MADISON AVE | 12 | | MAIN ROAD RD | 12 | | HARDING HWY | 10 | | BOULVARD | 8 | | RENA ST | 8 | | VICTORIA AVENUE AVE | 8 | | WEYMOUTH RD | 8 | | WHITEHALL ROAD RD | 8 | | DUTCH MILL | 6 | | HARDING | 6 | | OAKWOOD DR | 6 | | ROSEMONT AVE | 6 | | ROSEMONT AVENUE AVE | 6 | | SALEM AVE | 6 | | UNEXPECTED ROAD RD | 6 | | US ROUTE 40 RT | 6 | | WEST BLVD | 6 | | BLUE BELL ROAD RD | 4 | | CATAWBA | 4 |
| | | Fire incidents reported |
|---|
| Sreet name | Count |
|---|
| CHURCH ST | 4 | | CHURCH STREET ST | 4 | | GORGO LN | 4 | | HARDING HWY. | 4 | | HUNTER DR | 4 | | LAKE RD | 4 | | NORTHEAST BOULEVARD BLVD | 4 | | NORTHWEST BOULEVARD BLVD | 4 | | OAKLAND AVE | 4 | | PEARL STREET ST | 4 | | PINEY LANE LANE | 4 | | SALEM AVENUE AVE | 4 | | WOODLAWN AVENUE AVE | 4 | | 200 HELNA ST | 2 | | ARCH ST | 2 | | CATAWA AVE | 2 | | CATAWBA AV | 2 | | CATAWBA AVE | 2 | | DUTCH MILL RD | 2 | | FORSYTHIA DR | 2 | | GAIL LN | 2 | | GREENWOOD AVE | 2 | | GRUBB RD | 2 | | GRUBB ROAD RD | 2 | | |
|
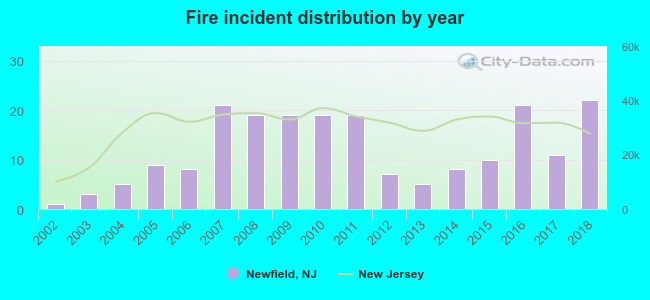 According to the data from the years 2002 - 2018 the average number of fire incidents per year is 12. The highest number of fires - 22 took place in 2018, and the least - 1 in 2002. The data has a rising trend.
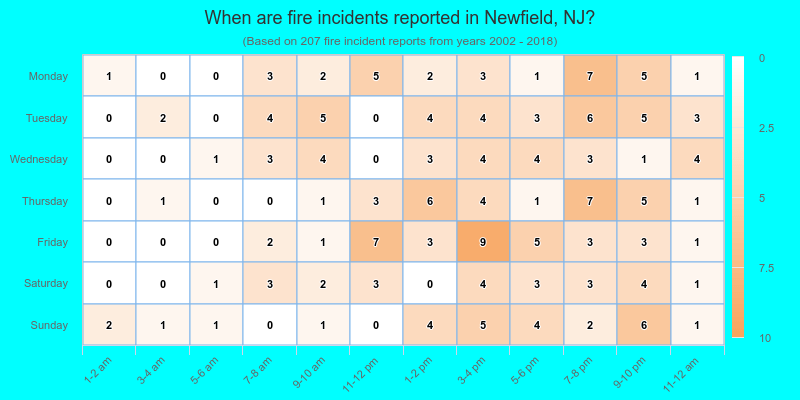
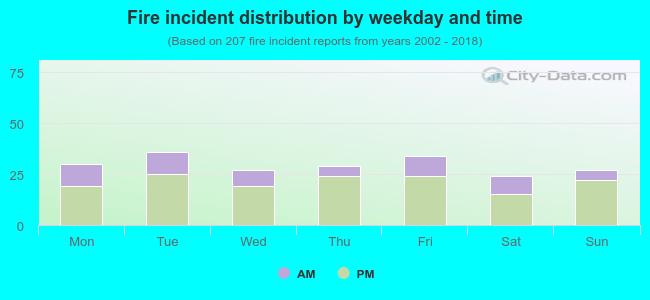 28.5% incidents where reported in the morning and 71.5% in the evening. The most fires (17.4%) took place on Tuesday, and the least (11.6%) on Saturday.
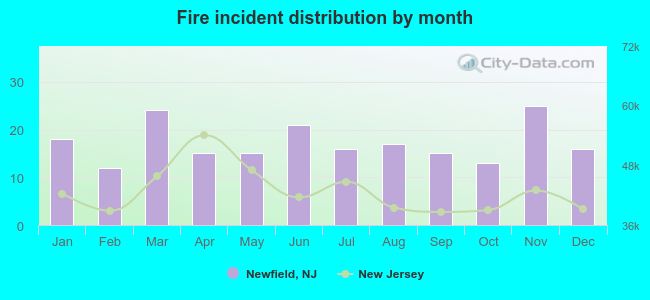 According to the 207 incident reports from years 2002 - 2018 most fires (12.1%) took place during November, and the least (5.8%) in February.
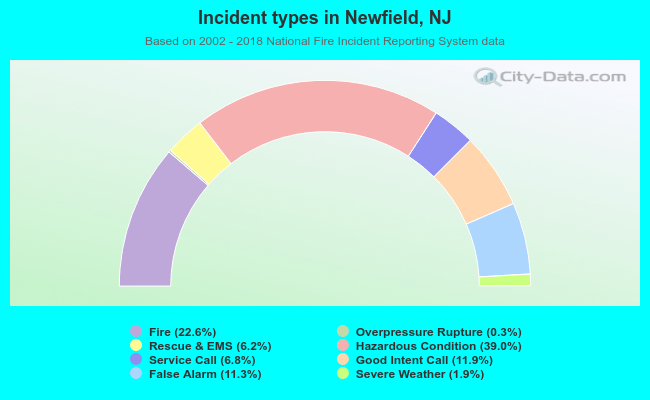 Out of all 915 cases reported during the years 2002 - 2018, the most belonged to the categories: Hazardous Condition (39.0%), Fire (22.6%), and Good Intent Call (11.9%).
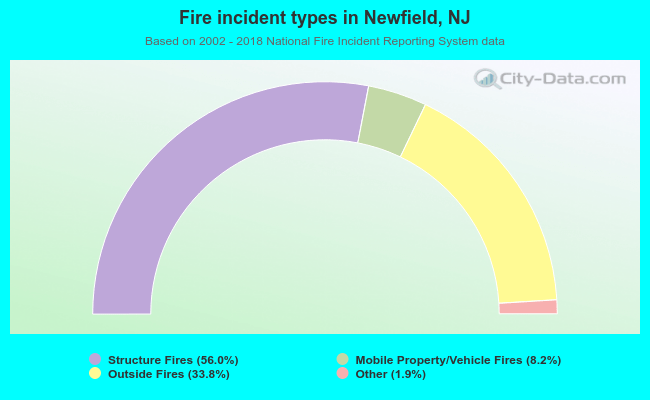 When looking into fire subcategories, the most reports belonged to: Structure Fires (56.0%), and Outside Fires (33.8%).