Nice: Fire Incidents, California (CA)
Where are fire incidents reported in Nice, CA
Something went wrong! Please refresh the page.
|
| |||||||||||||||||||||||||||||||||||||||||||||||||||||||||||||||||||||||||||||||||||||||||||||||||||||||||||||
2002 - 2018 National Fire Incident Reporting System (NFIRS) incidents
- Incident types reported to NFIRS in Nice, CA
- 2,01069.6%Rescue & EMS
- 39213.6%Service Call
- 2107.3%Fire
- 1565.4%Good Intent Call
- 772.7%Hazardous Condition
- 411.4%False Alarm
- 30.1%Overpressure Rupture
- Fire incident types reported to NFIRS in Nice, CA
- 9444.8%Outside Fires
- 7837.1%Structure Fires
- 2210.5%Mobile Property/Vehicle Fires
- 167.6%Other
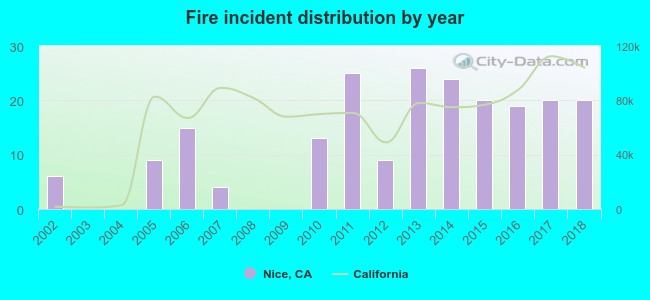 Based on the data from the years 2002 - 2018 the average number of fires per year is 12. The highest number of fires - 26 took place in 2013, and the least - 0 in 2003. The data has a growing trend.
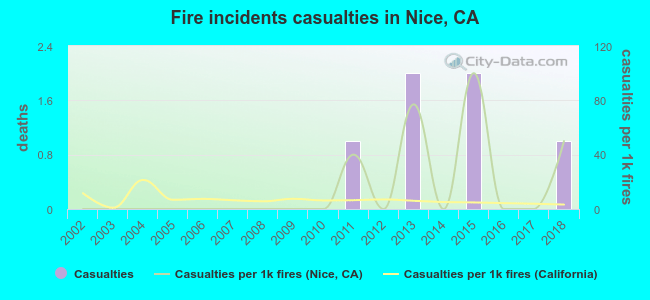 According to the data from the years 2002 - 2018 the average number of fire-related yearly casualties is 0. The highest number of reported casualties - 2 took place in 2013, and the lowest - 0 in 2002. The data has a rising trend.
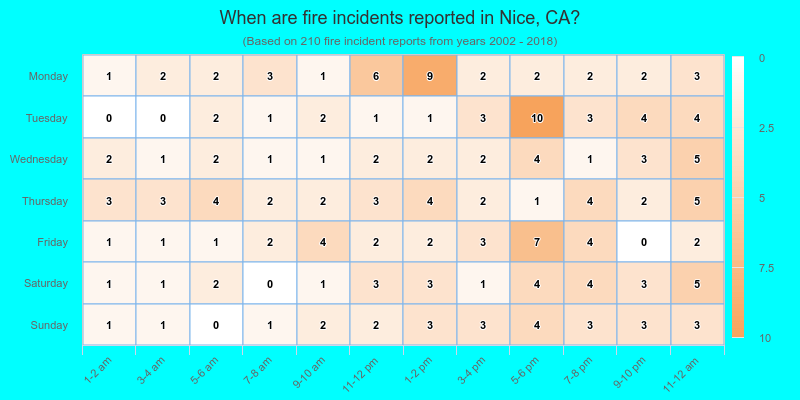
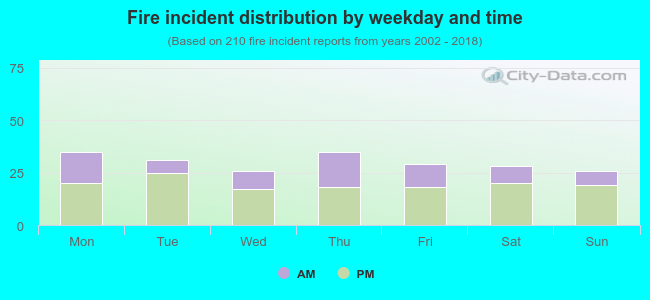 34.8% incidents where reported in the morning and 65.2% in the evening. The most fires (16.7%) took place on Monday, and the least (12.4%) on Wednesday.
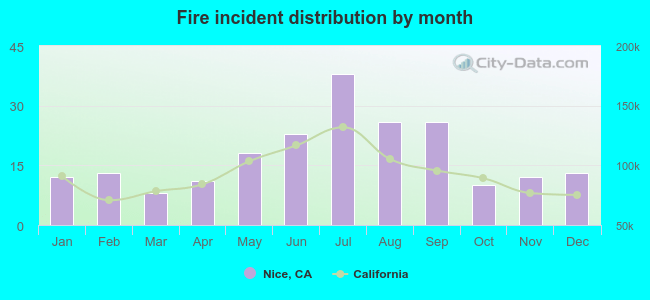 Based on the 210 fire incidents from years 2002 - 2018 most fires (18.1%) took place during July, and the least (3.8%) in March.
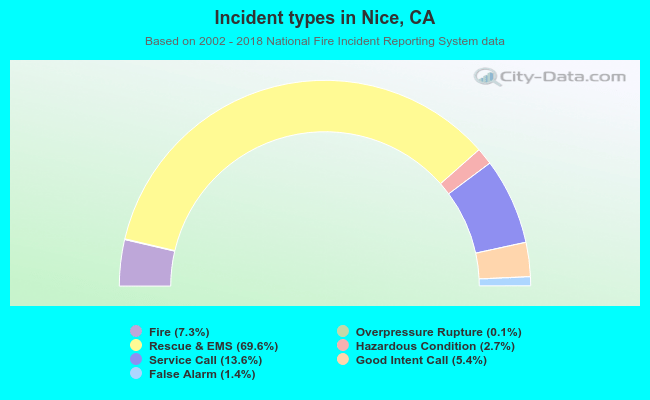 Out of all 2,889 cases reported during the years 2002 - 2018, the most belonged to the categories: Rescue & EMS (69.6%), Service Call (13.6%), and Fire (7.3%).
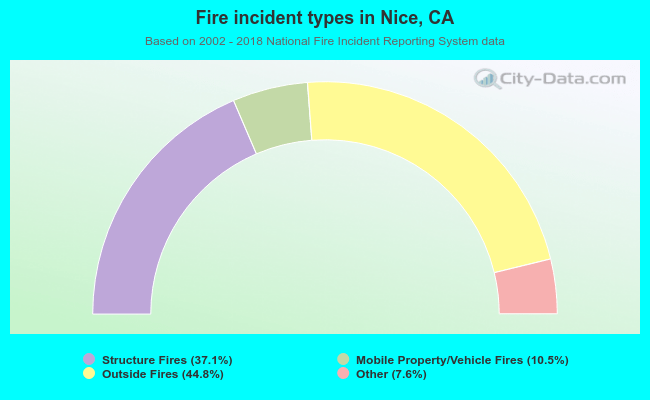 When looking into fire subcategories, the most incidents belonged to: Outside Fires (44.8%), and Structure Fires (37.1%).