Nogales: Fire Incidents, Arizona (AZ)
Where are fire incidents reported in Nogales, AZ
Something went wrong! Please refresh the page.
|
| |||||||||||||||||||||||||||||||||||||||||||||||||||||||||||||||||||||||||||||||||||||||||||||||||||||||||||||
2002 - 2018 National Fire Incident Reporting System (NFIRS) incidents
- Incident types reported to NFIRS in Nogales, AZ
- 5,34878.3%Rescue & EMS
- 5768.4%Hazardous Condition
- 5528.1%Fire
- 1532.2%Good Intent Call
- 1241.8%Service Call
- 721.1%False Alarm
- Fire incident types reported to NFIRS in Nogales, AZ
- 23141.8%Outside Fires
- 14726.6%Mobile Property/Vehicle Fires
- 12923.4%Structure Fires
- 458.2%Other
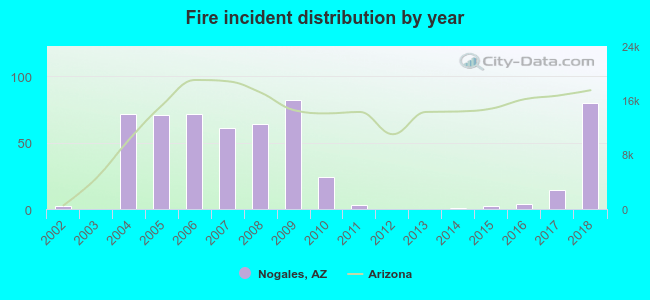 Based on the data from the years 2002 - 2018 the average number of fire incidents per year is 32. The highest number of fires - 82 took place in 2009, and the least - 0 in 2003. The data has a rising trend.
The average number of yearly fire incidents per 10k residents in Nogales, AZ compared to nearest cities:
(Note: Based on data for the last 3 years, including only cities with population 5,000 and above)
| Nogales: | 16.0 |
| Rio Rico: | 6.9 |
| Green Valley: | 23.5 |
| Arivaca: | 2.6 |
| Sahuarita: | 10.8 |
| Sierra Vista: | 15.5 |
| Corona de Tucson: | 2.6 |
| Vail: | 70.2 |
| South Tucson: | 40.1 |
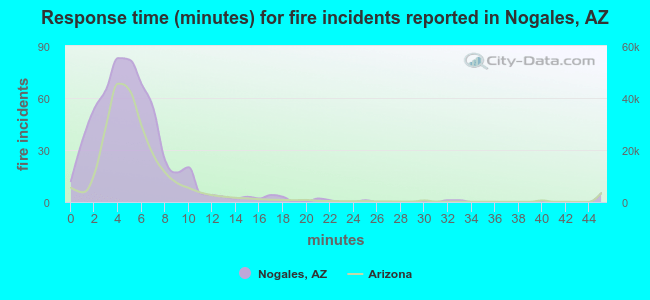 The median response time based on all reported fire incidents is 5 minutes. This is about the same as the Arizona median value.
The median response time in Nogales, AZ compared to nearest cities:
(Note: Based on data for all years, including only cities with at least 500 fire incidents)
| Nogales: | 5 minutes |
| Sierra Vista: | 6 minutes |
| Vail: | 9 minutes |
| Benson: | 12 minutes |
| Tucson: | 5 minutes |
| Marana: | 7 minutes |
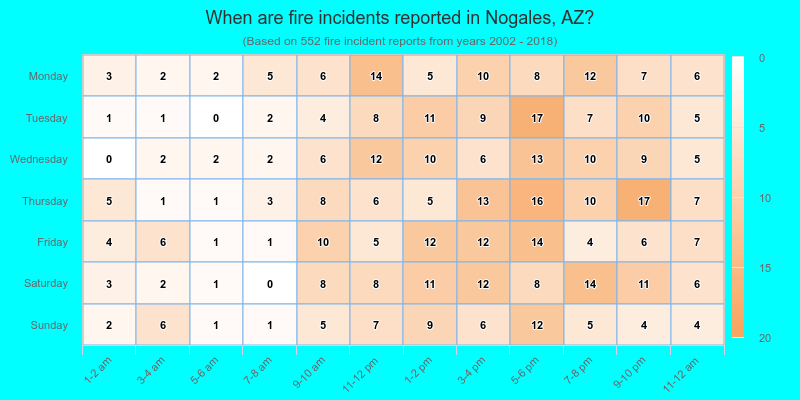
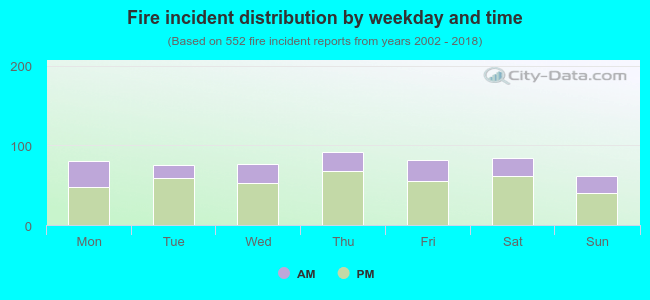 30.3% incidents where reported in the morning and 69.7% in the evening. The most fires (16.7%) took place on Thursday, and the least (11.2%) on Sunday.
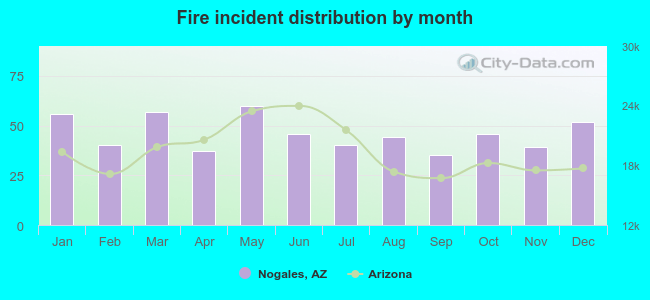 According to the 552 fires from years 2002 - 2018 most fires (10.9%) took place during May, and the least (6.3%) in September.
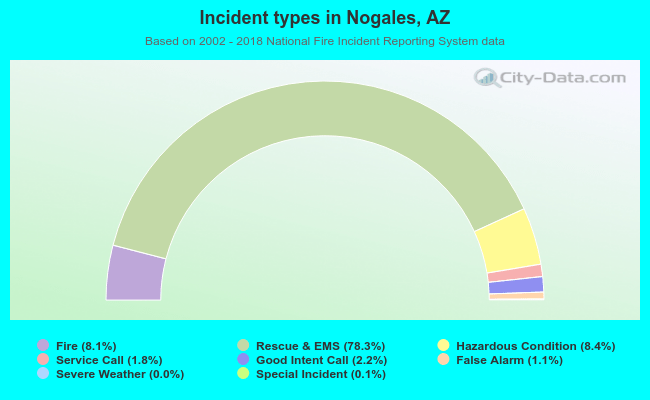 Out of all 6,832 cases reported during the years 2002 - 2018, the most belonged to the categories: Overpressure Rupture (78.3%), Rescue & EMS (8.4%), and Fire (8.1%).
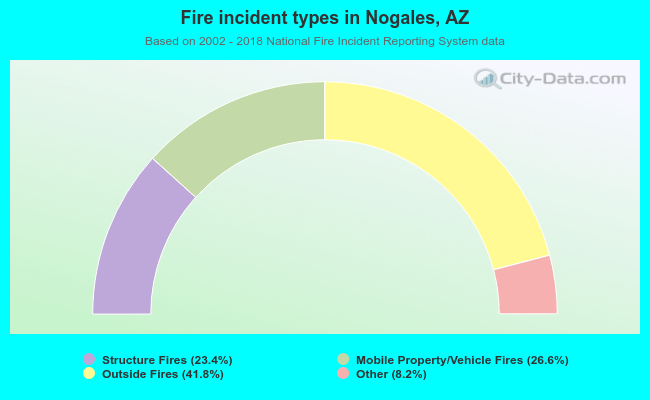 When looking into fire subcategories, the most incidents belonged to: Outside Fires (41.8%), and Mobile Property/Vehicle Fires (26.6%).