Norwood: Fire Incidents, Missouri (MO)
Where are fire incidents reported in Norwood, MO
Something went wrong! Please refresh the page.
|
| |||||||||||||||||||||||||||||||||||||||||||||||||||||||||||||||||||||||||||||||||||||||||||||||||||||||||||||
| Other | 2 | |||||||||||||||||||||||||||||||||||||||||||||||||||||||||||||||||||||||||||||||||||||||||||||||||||||||||||||
2002 - 2018 National Fire Incident Reporting System (NFIRS) incidents
- Incident types reported to NFIRS in Norwood, MO
- 66659.2%Rescue & EMS
- 31628.1%Fire
- 534.7%Hazardous Condition
- 494.4%Good Intent Call
- 121.1%Service Call
- 121.1%Severe Weather
- 90.8%False Alarm
- 70.6%Special Incident
- Fire incident types reported to NFIRS in Norwood, MO
- 14445.6%Outside Fires
- 12238.6%Structure Fires
- 4213.3%Mobile Property/Vehicle Fires
- 82.5%Other
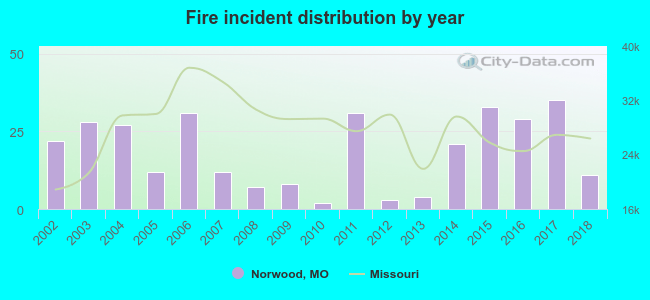 Based on the data from the years 2002 - 2018 the average number of fires per year is 19. The highest number of fire incidents - 35 took place in 2017, and the least - 2 in 2010. The data has a dropping trend.
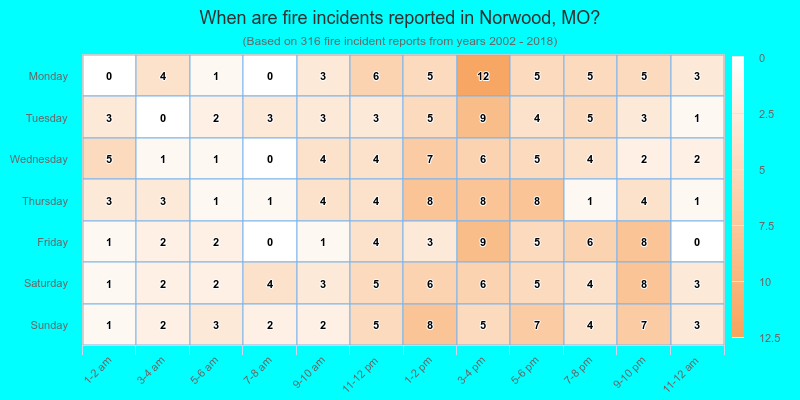
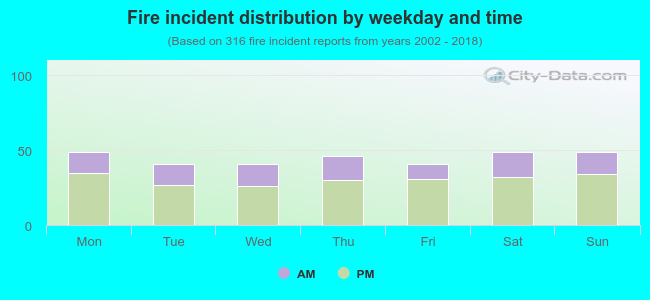 32.0% incidents where reported in the morning and 68.0% in the evening. The most fires (15.5%) took place on Monday, and the least (13.0%) on Tuesday.
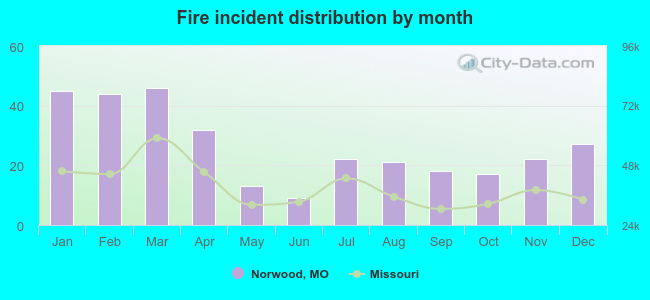 According to the 316 reports from years 2002 - 2018 most fires (14.6%) took place during March, and the least (2.8%) in June.
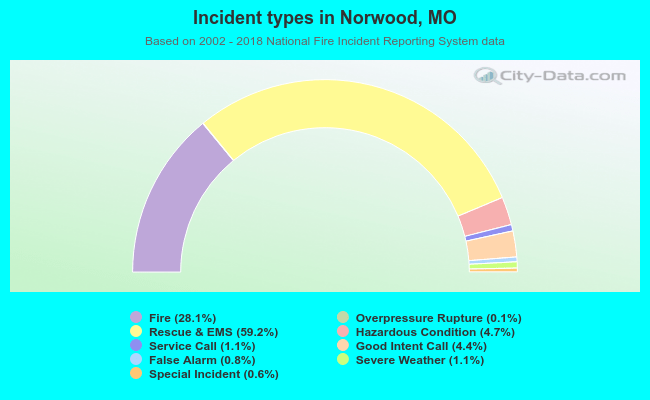 Out of all 1,125 cases reported during the years 2002 - 2018, the most belonged to the categories: Rescue & EMS (59.2%), Fire (28.1%), and Hazardous Condition (4.7%).
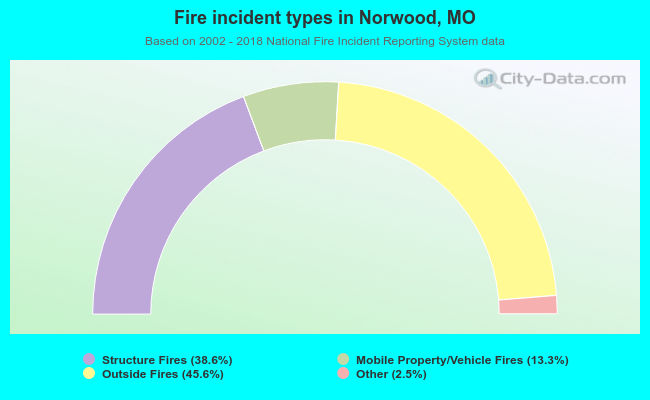 When looking into fire subcategories, the most incidents belonged to: Outside Fires (45.6%), and Structure Fires (38.6%).