Obion: Fire Incidents, Tennessee (TN)
Where are fire incidents reported in Obion, TN
Something went wrong! Please refresh the page.
|
| |||||||||||||||||||||||||||||||||||||||||||||||||||||||||||||||||||||||||||||||||||||||||||||||||||||||||||||
2002 - 2018 National Fire Incident Reporting System (NFIRS) incidents
- Incident types reported to NFIRS in Obion, TN
- 31452.3%Fire
- 23739.5%Rescue & EMS
- 203.3%Hazardous Condition
- 122.0%Good Intent Call
- 81.3%Service Call
- 71.2%False Alarm
- 20.3%Severe Weather
- Fire incident types reported to NFIRS in Obion, TN
- 16753.2%Structure Fires
- 9530.3%Outside Fires
- 4012.7%Mobile Property/Vehicle Fires
- 123.8%Other
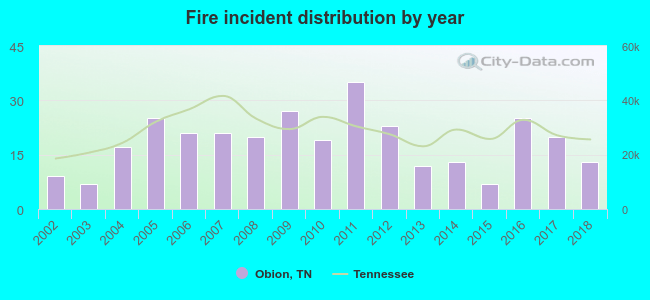 According to the data from the years 2002 - 2018 the average number of fires per year is 18. The highest number of reported fires - 35 took place in 2011, and the least - 7 in 2003. The data has a rising trend.
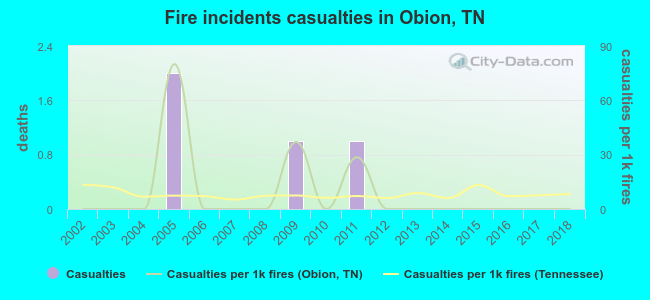 According to the reports from the years 2002 - 2018 the average number of fire-related casualties per year is 0. The highest number of injuries - 2 took place in 2005, and the lowest - 0 in 2002. The data has a constant trend.
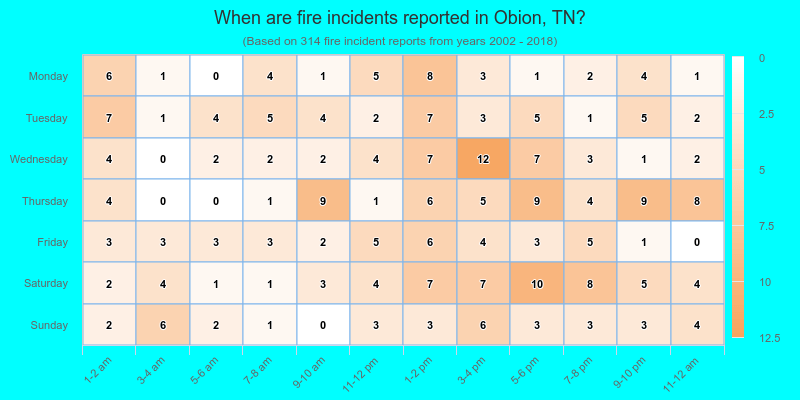
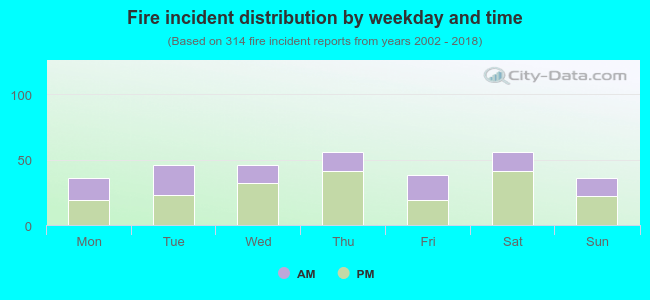 37.3% incidents where reported in the morning and 62.7% in the evening. The most fires (17.8%) took place on Thursday, and the least (11.5%) on Monday.
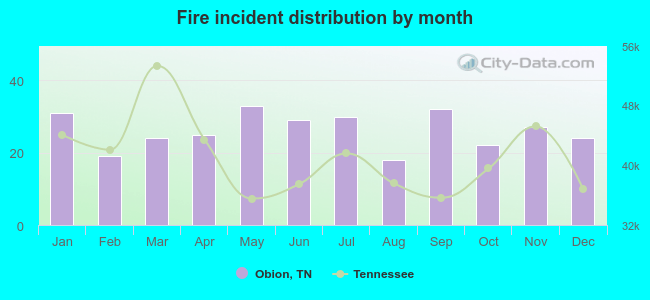 According to the 314 incident reports from years 2002 - 2018 most fires (10.5%) took place during May, and the least (5.7%) in August.
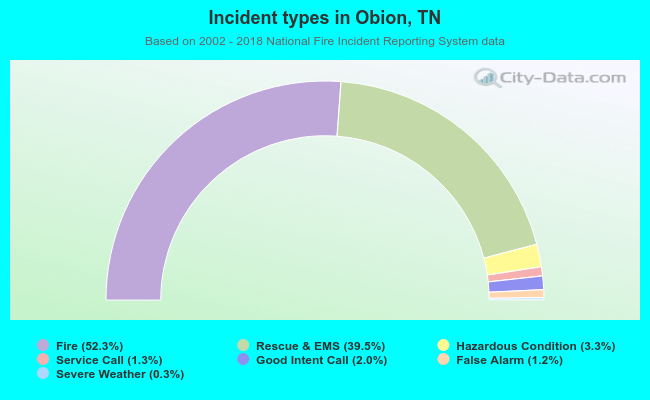 Out of all 600 cases reported during the years 2002 - 2018, the most belonged to the categories: Fire (52.3%), Overpressure Rupture (39.5%), and Rescue & EMS (3.3%).
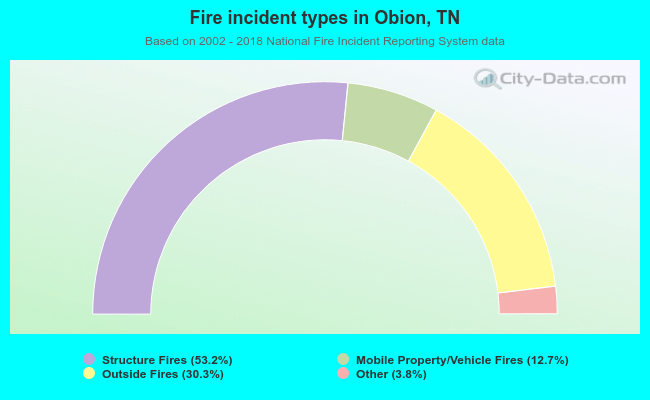 When looking into fire subcategories, the most incidents belonged to: Structure Fires (53.2%), and Outside Fires (30.3%).