Ocean Grove: Fire Incidents, New Jersey (NJ)
Where are fire incidents reported in Ocean Grove, NJ
Something went wrong! Please refresh the page.
|
| |||||||||||||||||||||||||||||||||||||||||||||||||||||||||||||||||||||||||||||||||||||||||||||||||||||||||||||
2005 - 2017 National Fire Incident Reporting System (NFIRS) incidents
- Incident types reported to NFIRS in Ocean Grove, NJ
- 38239.9%Hazardous Condition
- 27328.5%False Alarm
- 11712.2%Fire
- 707.3%Service Call
- 606.3%Rescue & EMS
- 495.1%Good Intent Call
- 60.6%Severe Weather
- 10.1%Special Incident
- Fire incident types reported to NFIRS in Ocean Grove, NJ
- 7362.4%Structure Fires
- 2521.4%Outside Fires
- 1311.1%Other
- 65.1%Mobile Property/Vehicle Fires
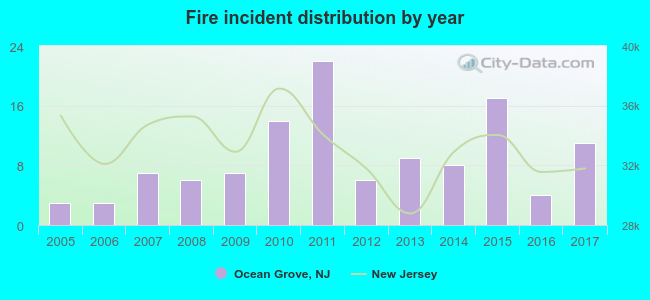 According to the data from the years 2005 - 2017 the average number of fire incidents per year is 9. The highest number of reported fire incidents - 22 took place in 2011, and the least - 3 in 2005. The data has a growing trend.
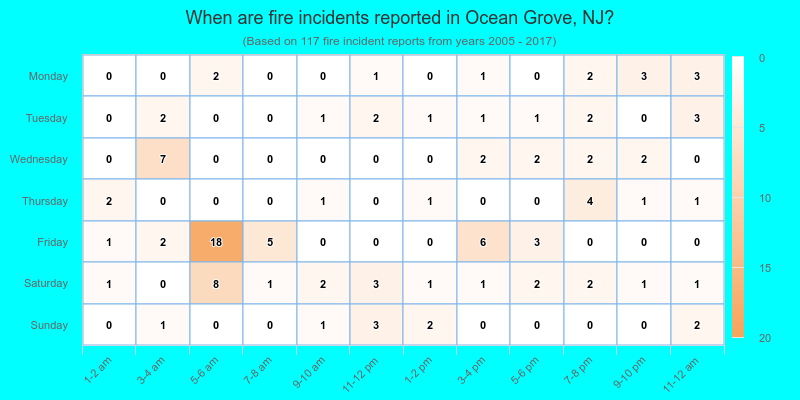
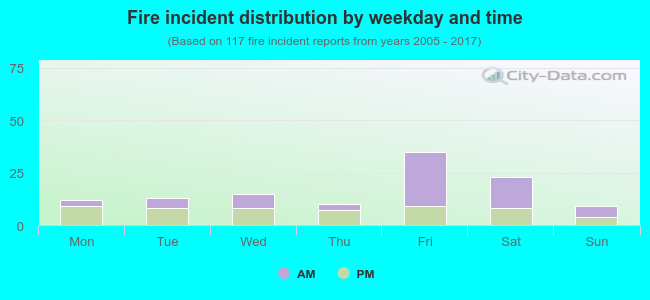 54.7% incidents where reported in the morning and 45.3% in the evening. The most fires (29.9%) took place on Friday, and the least (7.7%) on Sunday.
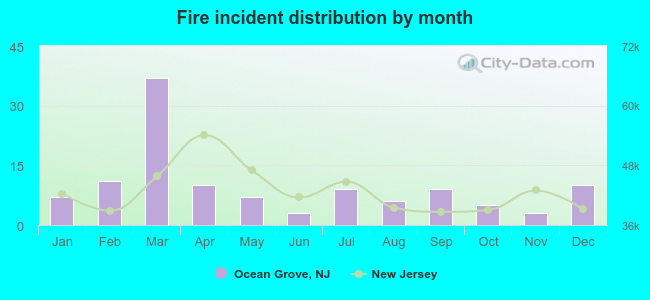 Based on the 117 fire incident reports from years 2005 - 2017 most fires (31.6%) took place during March, and the least (2.6%) in June.
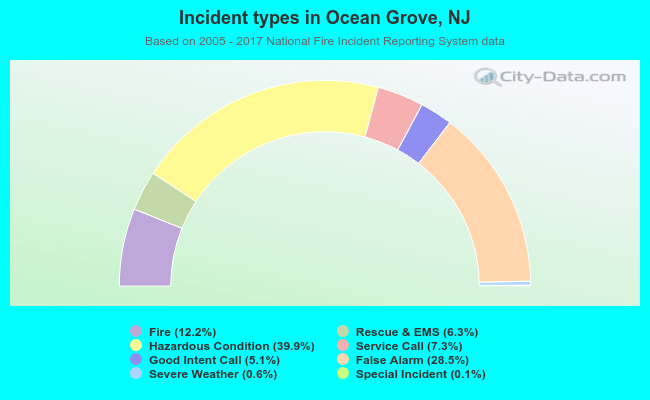 Out of all 958 cases reported during the years 2005 - 2017, the most belonged to the categories: Rescue & EMS (39.9%), Good Intent Call (28.5%), and Fire (12.2%).
 When looking into fire subcategories, the most reports belonged to: Structure Fires (62.4%), and Outside Fires (21.4%).