Ogema: Fire Incidents, Minnesota (MN)
Where are fire incidents reported in Ogema, MN
Something went wrong! Please refresh the page.
|
| |||||||||||||||||||||||||||||||||||||||||||||||||||||||||||||||||||||||||||||||||||||||||||||||||||||||||||||
| Other | 49 | |||||||||||||||||||||||||||||||||||||||||||||||||||||||||||||||||||||||||||||||||||||||||||||||||||||||||||||
2002 - 2018 National Fire Incident Reporting System (NFIRS) incidents
- Incident types reported to NFIRS in Ogema, MN
- 23982.1%Fire
- 186.2%Hazardous Condition
- 113.8%Rescue & EMS
- 113.8%Good Intent Call
- 103.4%False Alarm
- 10.3%Service Call
- 10.3%Severe Weather
- Fire incident types reported to NFIRS in Ogema, MN
- 12954.0%Structure Fires
- 8334.7%Outside Fires
- 197.9%Mobile Property/Vehicle Fires
- 83.3%Other
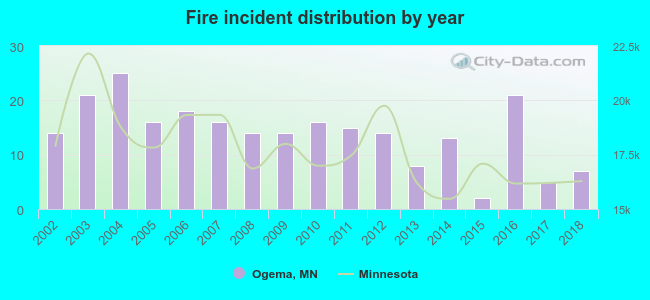 According to the data from the years 2002 - 2018 the average number of fires per year is 14. The highest number of reported fire incidents - 25 took place in 2004, and the least - 2 in 2015. The data has a decreasing trend.
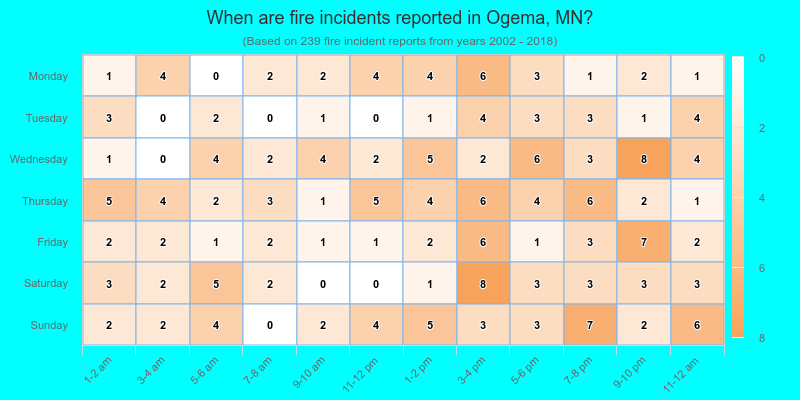
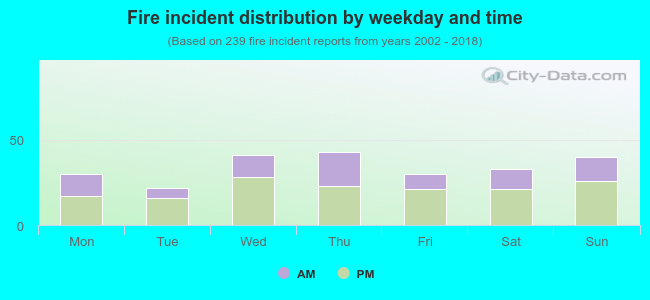 36.4% incidents where reported in the morning and 63.6% in the evening. The most fires (18.0%) took place on Thursday, and the least (9.2%) on Tuesday.
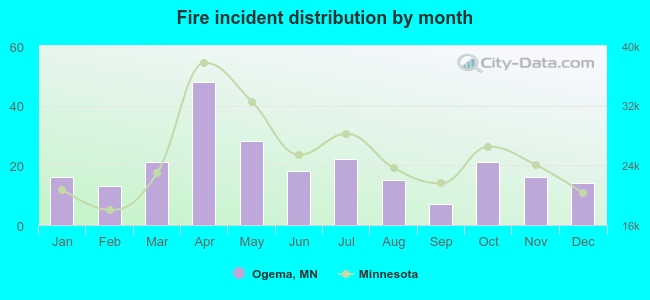 Based on the 239 incident reports from years 2002 - 2018 most fires (20.1%) took place during April, and the least (2.9%) in September.
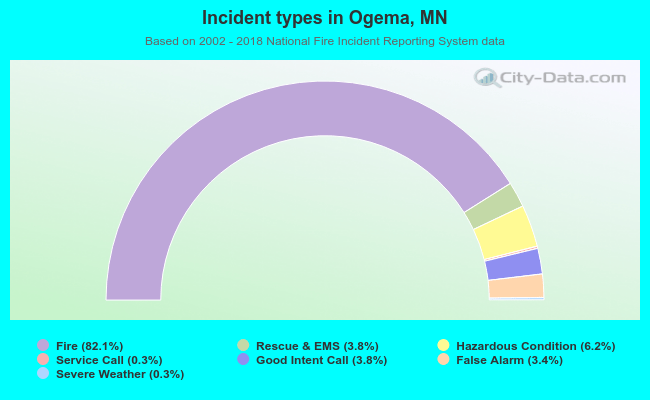 Out of all 291 cases reported during the years 2002 - 2018, the most belonged to the categories: Fire (82.1%), Rescue & EMS (6.2%), and Overpressure Rupture (3.8%).
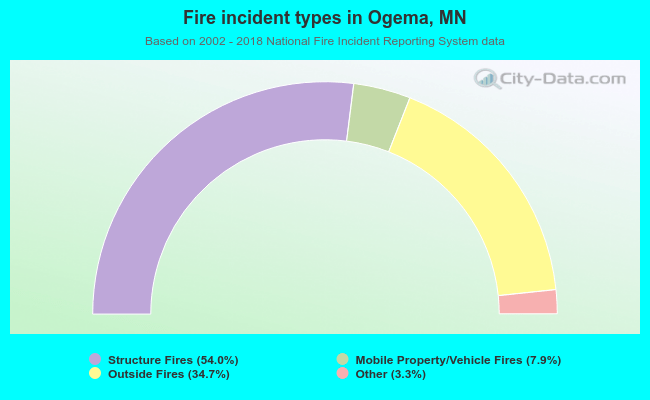 When looking into fire subcategories, the most reports belonged to: Structure Fires (54.0%), and Outside Fires (34.7%).