Okanogan: Fire Incidents, Washington (WA)
Where are fire incidents reported in Okanogan, WA
Something went wrong! Please refresh the page.
|
| |||||||||||||||||||||||||||||||||||||||||||||||||||||||||||||||||||||||||||||||||||||||||||||||||||||||||||||
2002 - 2018 National Fire Incident Reporting System (NFIRS) incidents
- Incident types reported to NFIRS in Okanogan, WA
- 59069.2%Fire
- 10412.2%Good Intent Call
- 516.0%Rescue & EMS
- 485.6%Hazardous Condition
- 384.5%False Alarm
- 182.1%Service Call
- 30.4%Severe Weather
- Fire incident types reported to NFIRS in Okanogan, WA
- 35359.8%Outside Fires
- 15125.6%Structure Fires
- 7913.4%Mobile Property/Vehicle Fires
- 71.2%Other
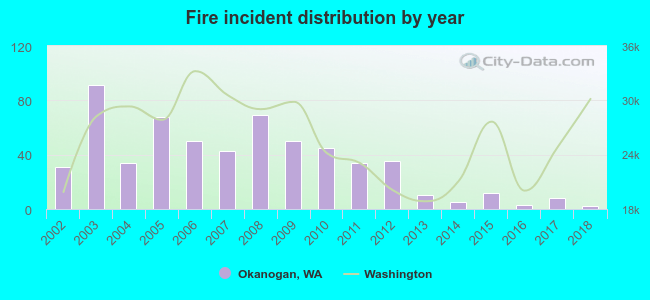 According to the data from the years 2002 - 2018 the average number of fires per year is 35. The highest number of reported fire incidents - 91 took place in 2003, and the least - 2 in 2018. The data has a decreasing trend.
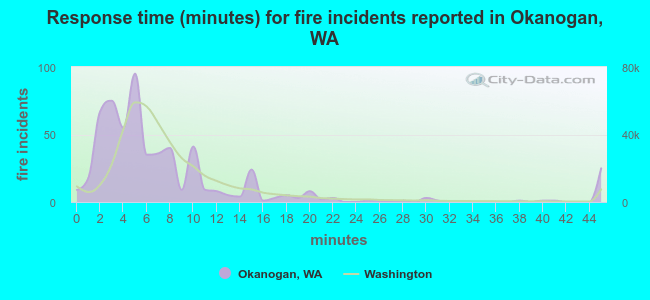 The median response time based on all reported fire incidents is 5 minutes. This is lower compared to the state median value.
The median response time in Okanogan, WA compared to nearest cities:
(Note: Based on data for all years, including only cities with at least 500 fire incidents)
| Okanogan: | 5 minutes |
| Omak: | 5 minutes |
| Brewster: | 10 minutes |
| Twisp: | 14 minutes |
| Chelan: | 10 minutes |
| Soap Lake: | 9 minutes |
| Kettle Falls: | 5 minutes |
| Ephrata: | 10 minutes |
| East Wenatchee: | 7 minutes |
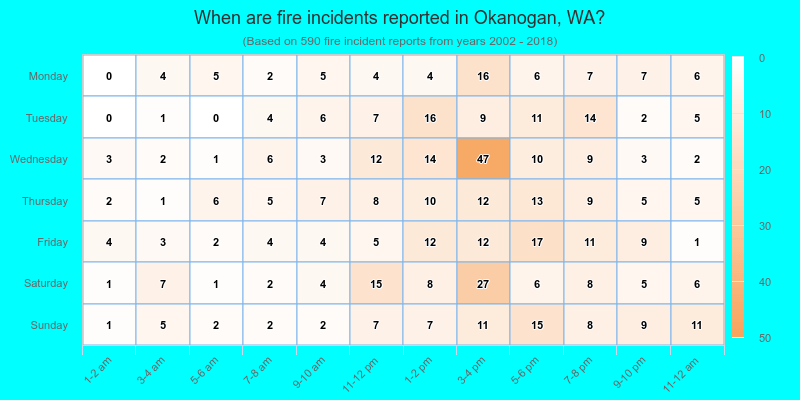
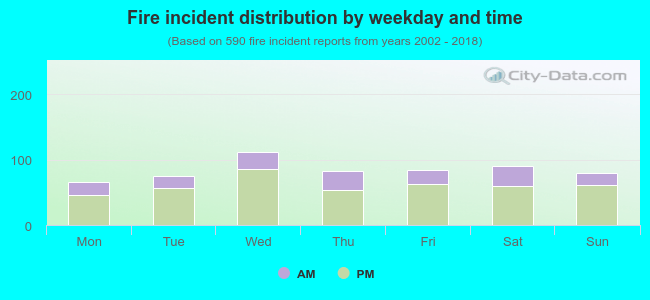 28.0% incidents where reported in the morning and 72.0% in the evening. The most fires (19.0%) took place on Wednesday, and the least (11.2%) on Monday.
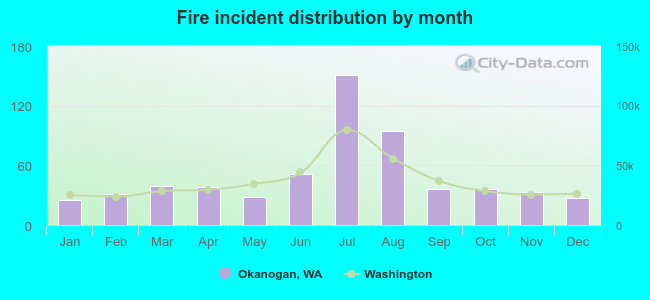 Based on the 590 fire incidents from years 2002 - 2018 most fires (25.6%) took place during July, and the least (4.2%) in January.
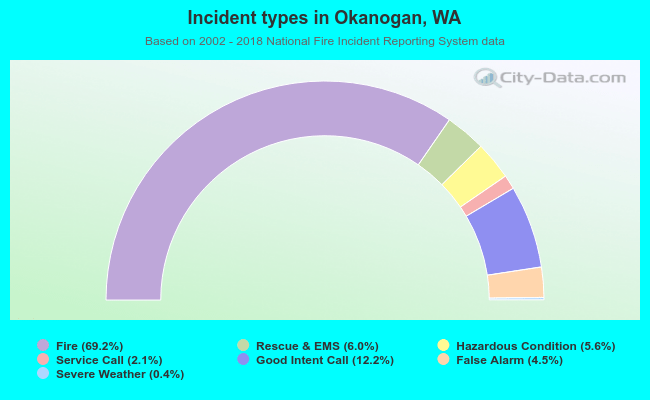 Out of all 852 cases reported during the years 2002 - 2018, the most belonged to the categories: Fire (69.2%), Service Call (12.2%), and Overpressure Rupture (6.0%).
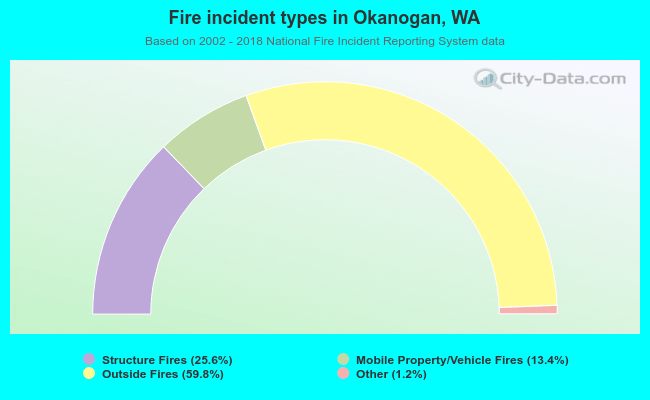 When looking into fire subcategories, the most reports belonged to: Outside Fires (59.8%), and Structure Fires (25.6%).