| Fire incidents reported |
|---|
| Sreet name | Count |
|---|
| CHICAGO RD | 34 | | I39 HWY | 24 | | PAW PAW RD | 24 | | CYCLONE RD | 12 | | GERMAN RD | 12 | | ANGLING RD | 8 | | COTTAGE HILL RD | 8 | | HOWLETT RD | 8 | | OGEE RD | 8 | | STEWARD RD | 8 | | 877 BINGHAM RD | 6 | | BINGHAM RD | 6 | | MOFFET RD | 6 | | 3059 CHICAGO RD | 4 | | BROOKLYN RD | 4 | | ELIZABETH ST | 4 | | WHEELER ST | 4 | | 1129 W SUYDAM RD | 2 | | 2310 SLEEPY HOLLOW | 2 | | 239 CHAPMAN | 2 | | 244 ELIZABETH | 2 | | 3021 COTTAGE HILL RD | 2 | | 3021 COTTAGE HILL ROAD | 2 | | 3059 CHICAGO ROAD | 2 | | 3315 CHICAGO RD | 2 |
| | | Fire incidents reported |
|---|
| Sreet name | Count |
|---|
| 336 CLARK ST | 2 | | 337 WYOMING | 2 | | 351 CHICAGO RD | 2 | | 355096 HOWLETT RD | 2 | | 3583 SOUTH PAW PAW RD | 2 | | 3590 HOWLETT ROAD | 2 | | 401 HEDGE RD | 2 | | 595 HEDGE GROVE ROAD | 2 | | 626 HEDGE RD | 2 | | 639 GERMAN RD | 2 | | 886 GERMAN RD | 2 | | 937 STEWARD RD | 2 | | BINGHAM RD | 2 | | CARNAHAN RD | 2 | | CHAPMAN ST ST | 2 | | COTTAGE HILL ROAD | 2 | | DREDGE RD | 2 | | EARLVILLE RD | 2 | | ELIZABETH ST | 2 | | FLAGG ST | 2 | | GRUMMON ST | 2 | | HEDGE RD | 2 | | I39 AT COTTAGE HILL RD | 2 | | LIONS DR | 2 | | MANGER RD | 2 |
|
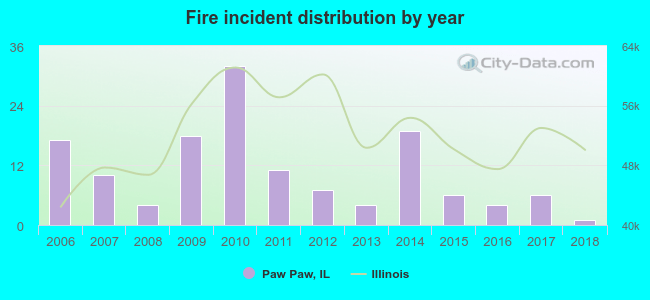 Based on the data from the years 2006 - 2018 the average number of fires per year is 11. The highest number of fire incidents - 32 took place in 2010, and the least - 1 in 2018. The data has a decreasing trend.
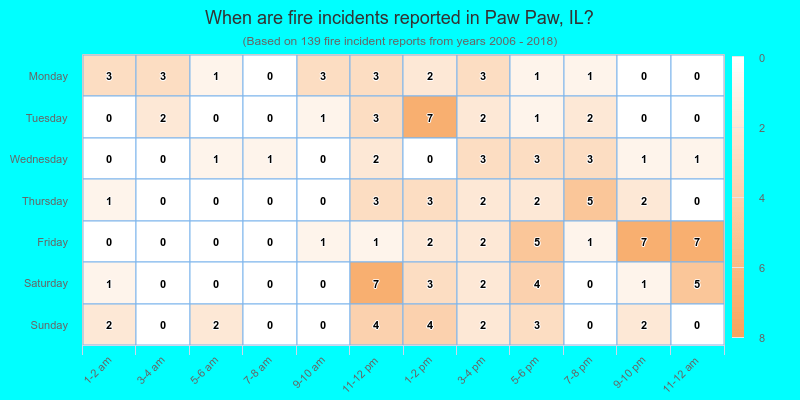
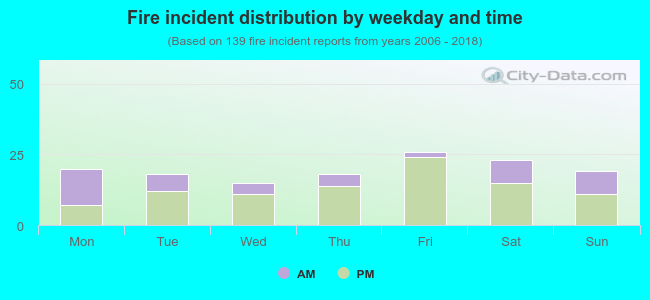 32.4% incidents where reported in the morning and 67.6% in the evening. The most fires (18.7%) took place on Friday, and the least (10.8%) on Wednesday.
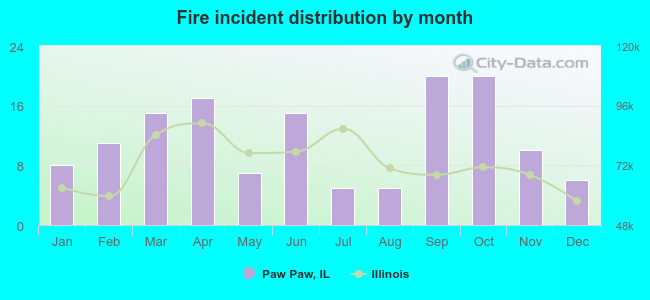 According to the 139 reports from years 2006 - 2018 most fires (14.4%) took place during September, and the least (3.6%) in July.
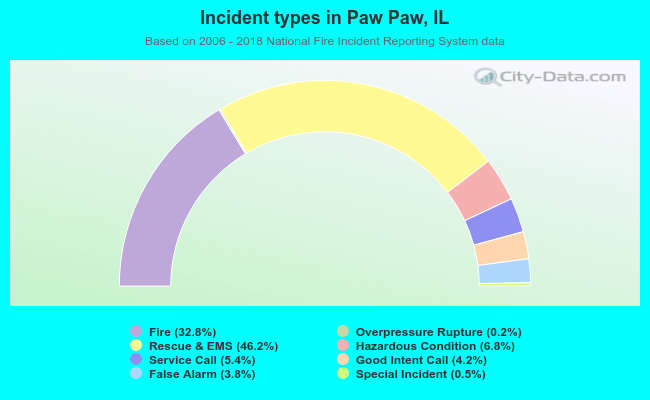 Out of all 424 cases reported during the years 2006 - 2018, the most belonged to the categories: Rescue & EMS (46.2%), Fire (32.8%), and Hazardous Condition (6.8%).
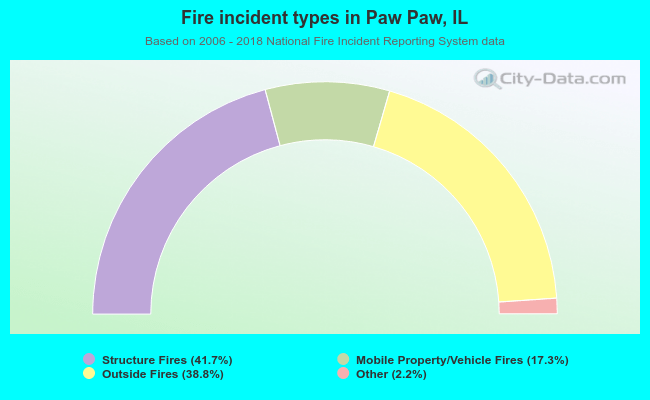 When looking into fire subcategories, the most reports belonged to: Structure Fires (41.7%), and Outside Fires (38.8%).