Pelham: Fire Incidents, Georgia (GA)
Where are fire incidents reported in Pelham, GA
Something went wrong! Please refresh the page.
|
| |||||||||||||||||||||||||||||||||||||||||||||||||||||||||||||||||||||||||||||||||||||||||||||||||||||||||||||
2002 - 2018 National Fire Incident Reporting System (NFIRS) incidents
- Incident types reported to NFIRS in Pelham, GA
- 1,10242.6%Rescue & EMS
- 82031.7%Fire
- 33012.7%Hazardous Condition
- 2329.0%Good Intent Call
- 461.8%False Alarm
- 411.6%Service Call
- 110.4%Special Incident
- 60.2%Severe Weather
- Fire incident types reported to NFIRS in Pelham, GA
- 34742.3%Outside Fires
- 33841.2%Structure Fires
- 10813.2%Mobile Property/Vehicle Fires
- 273.3%Other
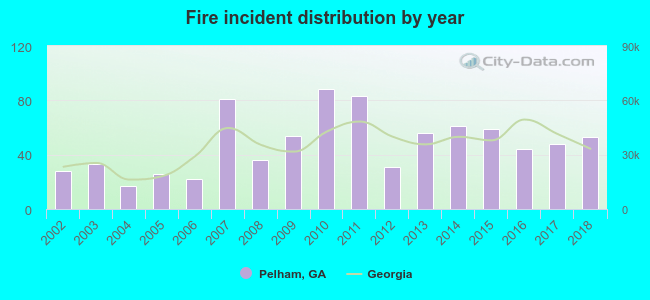 According to the data from the years 2002 - 2018 the average number of fires per year is 48. The highest number of fires - 88 took place in 2010, and the least - 17 in 2004. The data has an increasing trend.
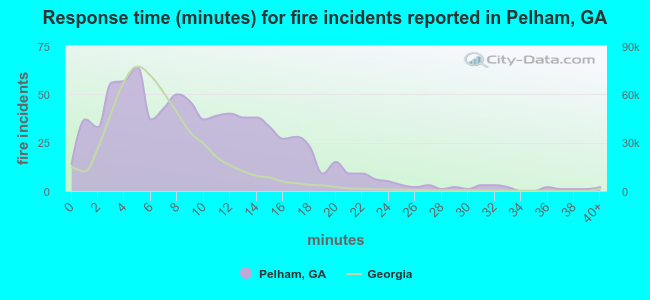 The median response time based on all reported fire incidents is 9 minutes. This is higher than the state median value.
The median response time in Pelham, GA compared to nearest cities:
(Note: Based on data for all years, including only cities with at least 500 fire incidents)
| Pelham: | 9 minutes |
| Camilla: | 6 minutes |
| Baconton: | 8 minutes |
| Cairo: | 6 minutes |
| Moultrie: | 5 minutes |
| Thomasville: | 6 minutes |
| Bainbridge: | 4 minutes |
| Norman Park: | 8 minutes |
| Albany: | 5 minutes |
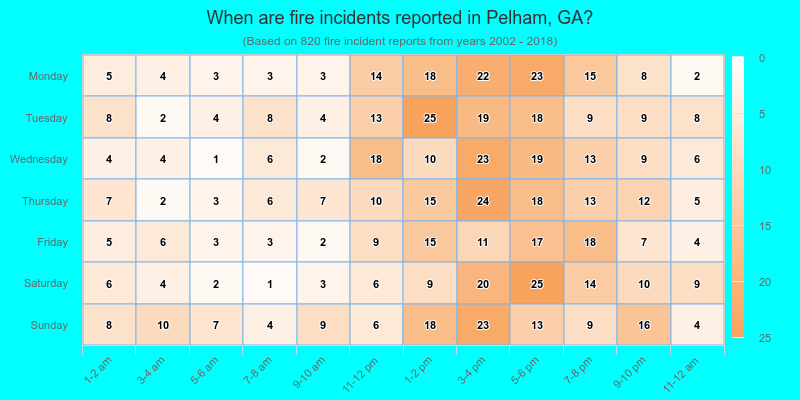
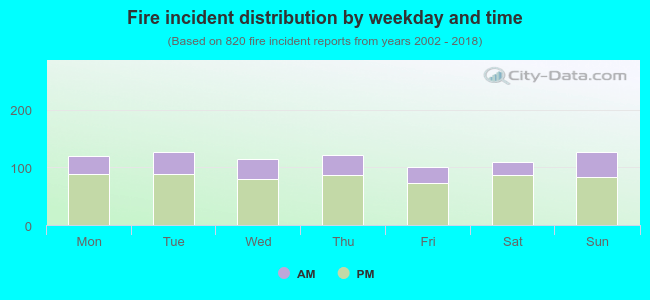 28.7% incidents where reported in the morning and 71.3% in the evening. The most fires (15.5%) took place on Tuesday, and the least (12.2%) on Friday.
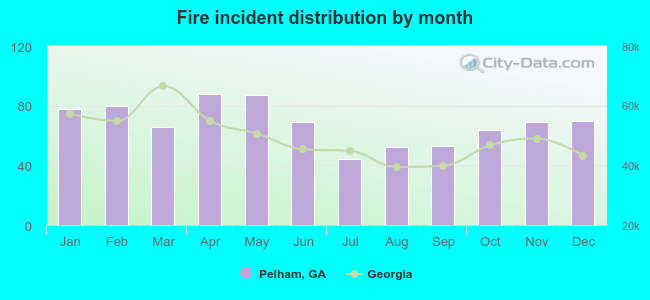 According to the 820 fire incident reports from years 2002 - 2018 most fires (10.7%) took place during April, and the least (5.4%) in July.
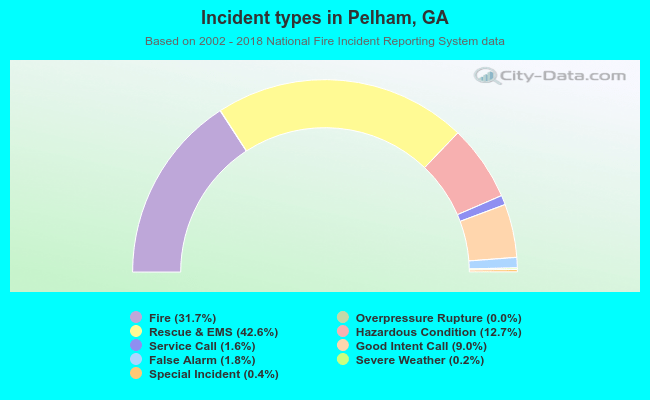 Out of all 2,589 cases reported during the years 2002 - 2018, the most belonged to the categories: Rescue & EMS (42.6%), Fire (31.7%), and Hazardous Condition (12.7%).
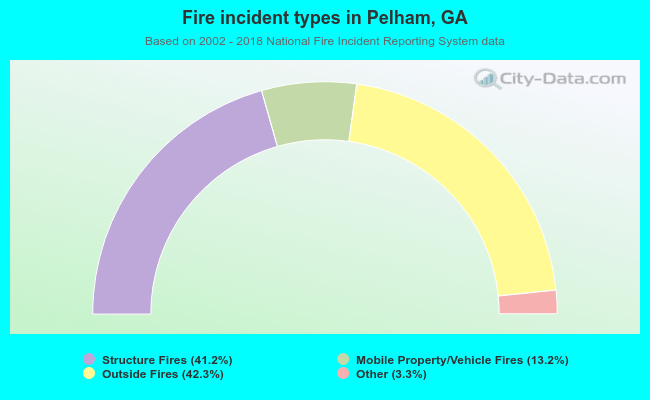 When looking into fire subcategories, the most reports belonged to: Outside Fires (42.3%), and Structure Fires (41.2%).