Pilot Point: Fire Incidents, Texas (TX)
Where are fire incidents reported in Pilot Point, TX
Something went wrong! Please refresh the page.
|
| |||||||||||||||||||||||||||||||||||||||||||||||||||||||||||||||||||||||||||||||||||||||||||||||||||||||||||||
2002 - 2018 National Fire Incident Reporting System (NFIRS) incidents
- Incident types reported to NFIRS in Pilot Point, TX
- 2,27438.7%Rescue & EMS
- 1,27421.7%Good Intent Call
- 93015.8%Service Call
- 88915.1%Fire
- 3526.0%Hazardous Condition
- 1522.6%False Alarm
- Fire incident types reported to NFIRS in Pilot Point, TX
- 55662.5%Outside Fires
- 23426.3%Structure Fires
- 707.9%Mobile Property/Vehicle Fires
- 293.3%Other
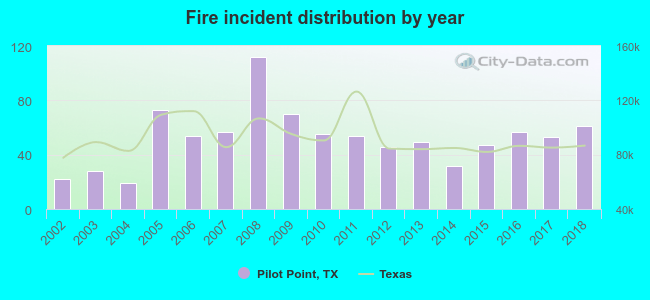 Based on the data from the years 2002 - 2018 the average number of fire incidents per year is 52. The highest number of reported fires - 112 took place in 2008, and the least - 19 in 2004. The data has a growing trend.
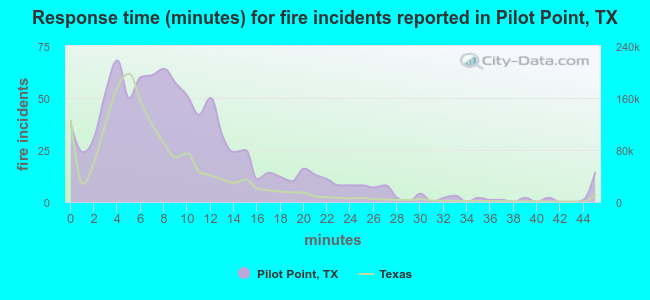 The median response time based on all reported fire incidents is 8 minutes. This is higher than the Texas median value.
The median response time in Pilot Point, TX compared to nearest cities:
(Note: Based on data for all years, including only cities with at least 500 fire incidents)
| Pilot Point: | 8 minutes |
| Aubrey: | 9 minutes |
| Celina: | 9 minutes |
| Sanger: | 11 minutes |
| Valley View: | 12 minutes |
| Prosper: | 6 minutes |
| Denton: | 6 minutes |
| Little Elm: | 7 minutes |
| Krum: | 9 minutes |
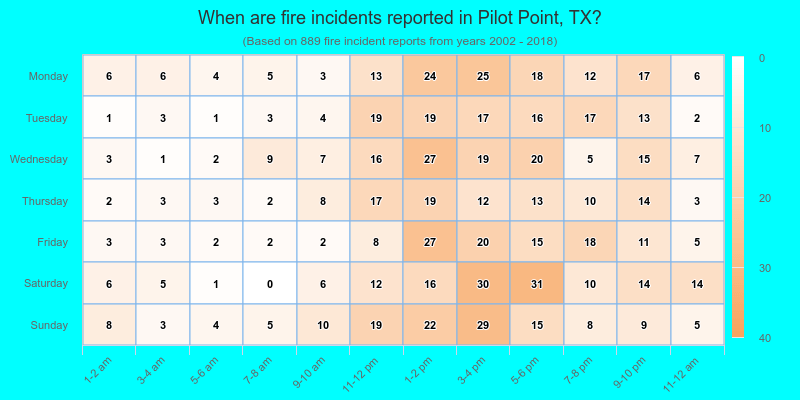
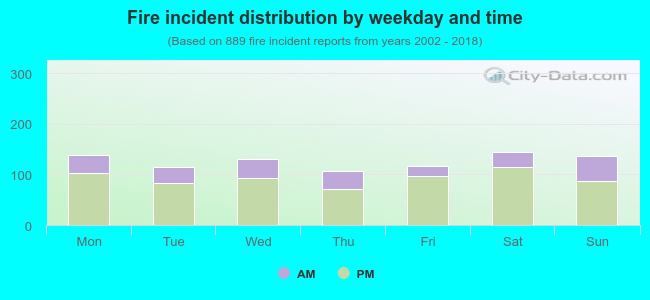 27.0% incidents where reported in the morning and 73.0% in the evening. The most fires (16.3%) took place on Saturday, and the least (11.9%) on Thursday.
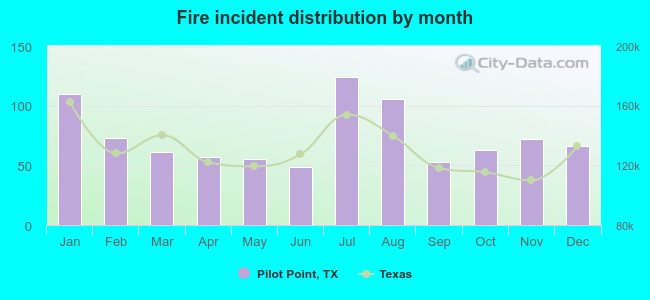 Based on the 889 reports from years 2002 - 2018 most fires (13.9%) took place during July, and the least (5.5%) in June.
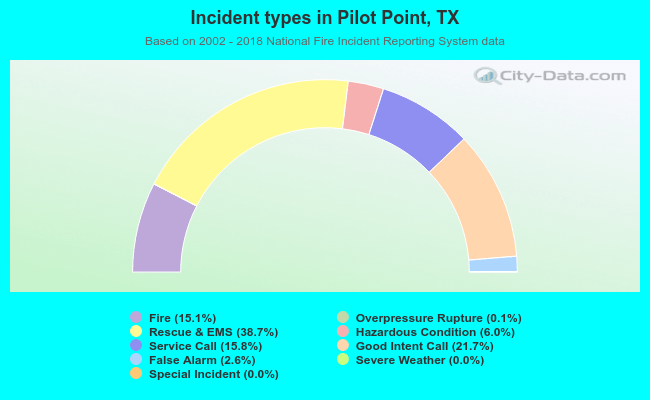 Out of all 5,876 cases reported during the years 2002 - 2018, the most belonged to the categories: Rescue & EMS (38.7%), Good Intent Call (21.7%), and Service Call (15.8%).
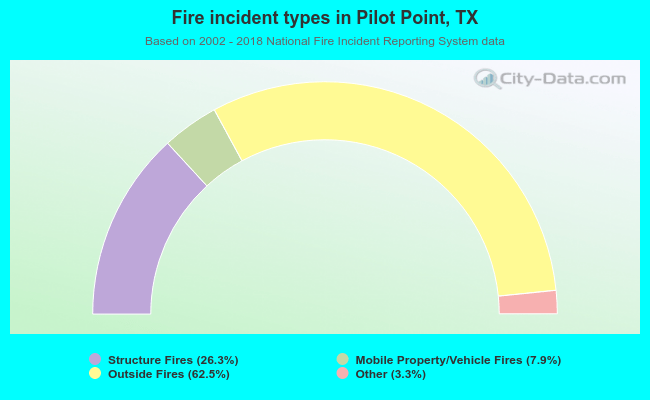 When looking into fire subcategories, the most incidents belonged to: Outside Fires (62.5%), and Structure Fires (26.3%).