| Fire incidents reported |
|---|
| Sreet name | Count |
|---|
| HWY 88 | 132 | | HIGHWAY 88 | 32 | | PIONEER CREEK ROAD | 20 | | SILVER DRIVE | 20 | | SUGAR PINE DRIVE | 20 | | TIGER CREEK ROAD | 20 | | MEADOW DRIVE | 16 | | RED CORRAL ROAD | 16 | | BUCKHORN RIDGE ROAD | 14 | | CARSON DRIVE | 14 | | PIONEER CREEK RD | 12 | | MEADOW VISTA DRIVE | 10 | | PANTHER CREEK ROAD | 10 | | PROSPECT PLACE | 10 | | WILLIAMS ROAD | 10 | | WOODCREST DRIVE | 10 | | BARTON ROAD | 8 | | CEDAR HEIGHTS DRIVE NORTH | 8 | | DIAMOND VIEW DRIVE | 8 | | INSPIRATION DRIVE WEST | 8 | | PIONEER VOLCANO ROAD | 8 | | ROBIN ROAD | 8 | | ROCKY LANE | 8 | | SALT SPRINGS ROAD | 8 | | WAGON WHEEL DRIVE | 8 |
| | | Fire incidents reported |
|---|
| Sreet name | Count |
|---|
| ALPINE DRIVE | 6 | | ANTELOPE DRIVE | 6 | | BEAR RIVER ROAD | 6 | | CANYON VIEW COURT | 6 | | CRAWLEY LANE | 6 | | CRYSTAL RIDGE COURT | 6 | | DEFENDER GRADE | 6 | | DEFENDER GRADE ROAD | 6 | | FAIRWAY DRIVE | 6 | | FORTRESS WAY | 6 | | GOLD DUST ROAD | 6 | | GOLF LINKS DRIVE | 6 | | MACE DRIVE | 6 | | RIDGE DRIVE | 6 | | SCHAEFER RANCH ROAD | 6 | | SHAKE RIDGE ROAD | 6 | | SUNRISE TERRACE | 6 | | WILLIAMS RD | 6 | | WOODRIDGE DRIVE | 6 | | 88 HWY | 4 | | ACORN COURT | 4 | | ANTELOPE COURT | 4 | | BELDON MINE ROAD | 4 | | CA 88 HWY | 4 | | CAROLYN COURT | 4 |
|
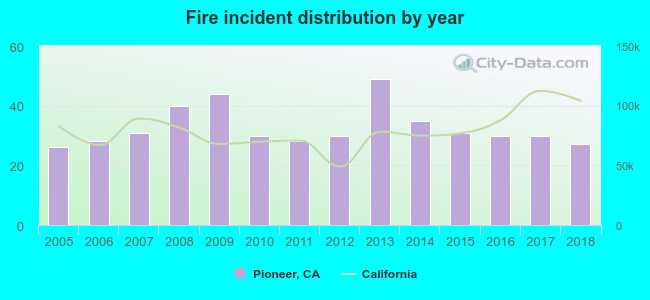 Based on the data from the years 2005 - 2018 the average number of fires per year is 33. The highest number of reported fires - 49 took place in 2013, and the least - 26 in 2005. The data has a growing trend.
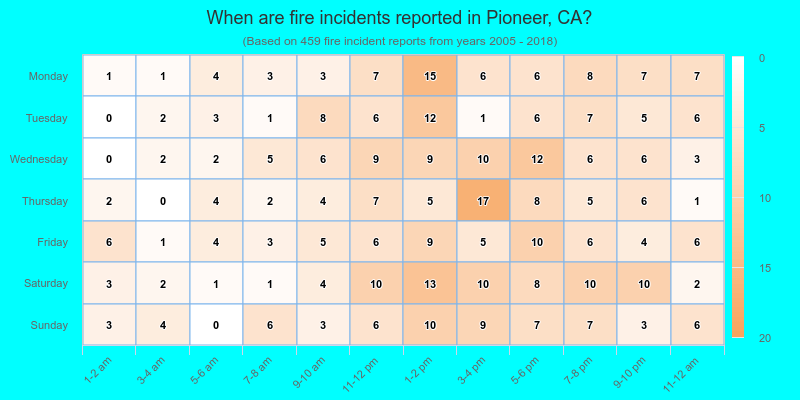
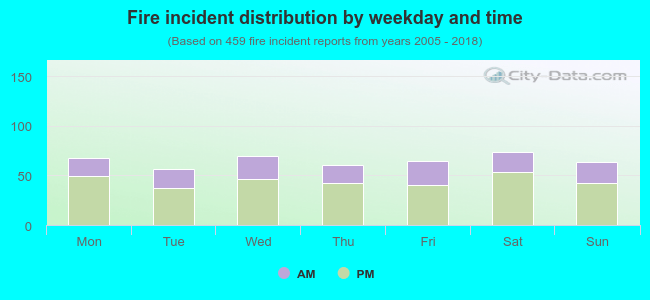 32.7% incidents where reported in the morning and 67.3% in the evening. The most fires (16.1%) took place on Saturday, and the least (12.4%) on Tuesday.
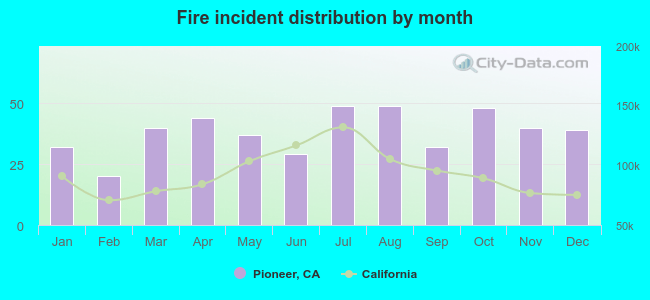 According to the 459 reports from years 2005 - 2018 most fires (10.7%) took place during July, and the least (4.4%) in February.
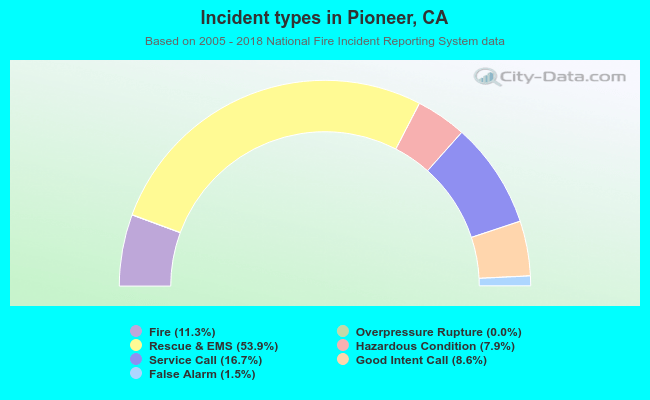 Out of all 4,080 cases reported during the years 2005 - 2018, the most belonged to the categories: Rescue & EMS (53.9%), Service Call (16.7%), and Fire (11.3%).
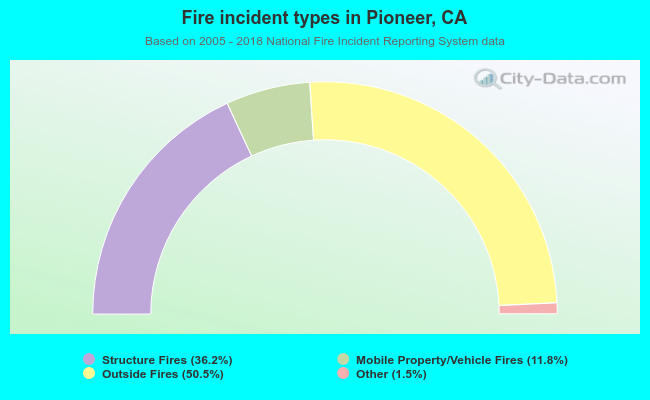 When looking into fire subcategories, the most reports belonged to: Outside Fires (50.5%), and Structure Fires (36.2%).