Pittsboro: Fire Incidents, Indiana (IN)
Where are fire incidents reported in Pittsboro, IN
Something went wrong! Please refresh the page.
|
| |||||||||||||||||||||||||||||||||||||||||||||||||||||||||||||||||||||||||||||||||||||||||||||||||||||||||||||
2002 - 2017 National Fire Incident Reporting System (NFIRS) incidents
- Incident types reported to NFIRS in Pittsboro, IN
- 47534.6%Fire
- 38928.3%Rescue & EMS
- 25518.6%Good Intent Call
- 14810.8%Hazardous Condition
- 695.0%Service Call
- 272.0%False Alarm
- 60.4%Severe Weather
- 20.1%Overpressure Rupture
- 20.1%Special Incident
- Fire incident types reported to NFIRS in Pittsboro, IN
- 20442.9%Structure Fires
- 16133.9%Outside Fires
- 6714.1%Mobile Property/Vehicle Fires
- 439.1%Other
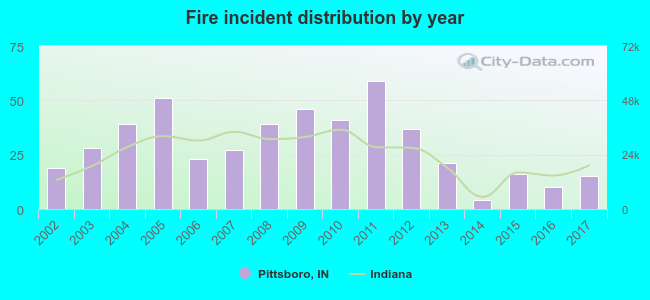 According to the data from the years 2002 - 2017 the average number of fires per year is 30. The highest number of reported fire incidents - 59 took place in 2011, and the least - 4 in 2014. The data has a declining trend.
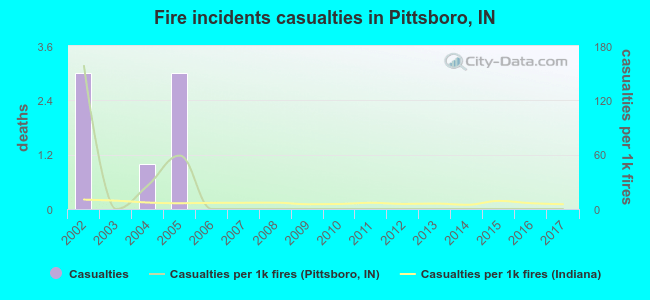 According to the data from the years 2002 - 2017 the average number of fire-related casualties per year is 0. The highest number of injuries - 3 took place in 2002, and the lowest - 0 in 2003. The data has a declining trend.
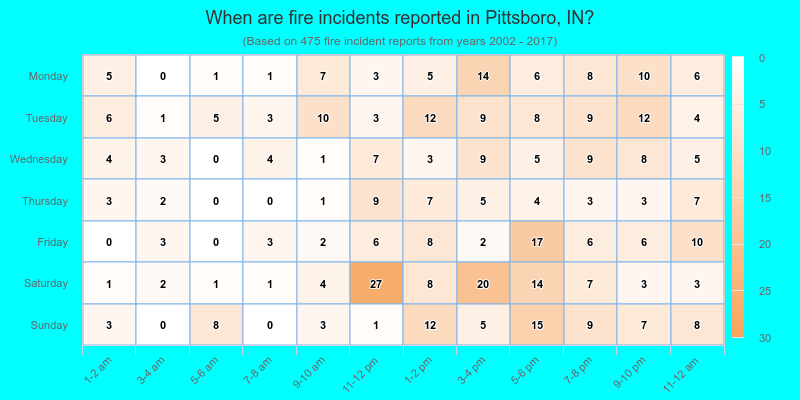
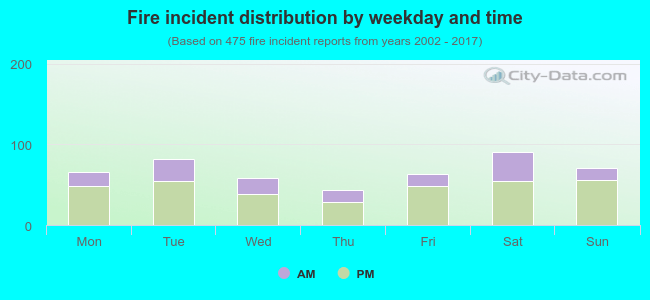 30.3% incidents where reported in the morning and 69.7% in the evening. The most fires (19.2%) took place on Saturday, and the least (9.3%) on Thursday.
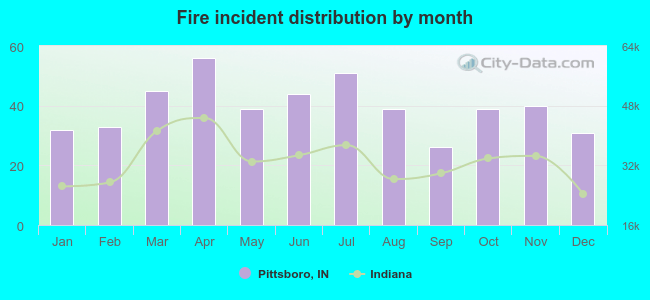 According to the 475 reports from years 2002 - 2017 most fires (11.8%) took place during April, and the least (5.5%) in September.
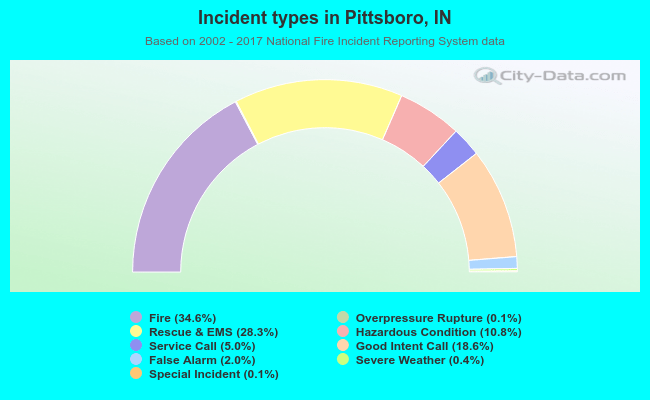 Out of all 1,373 cases reported during the years 2002 - 2017, the most belonged to the categories: Fire (34.6%), Rescue & EMS (28.3%), and Good Intent Call (18.6%).
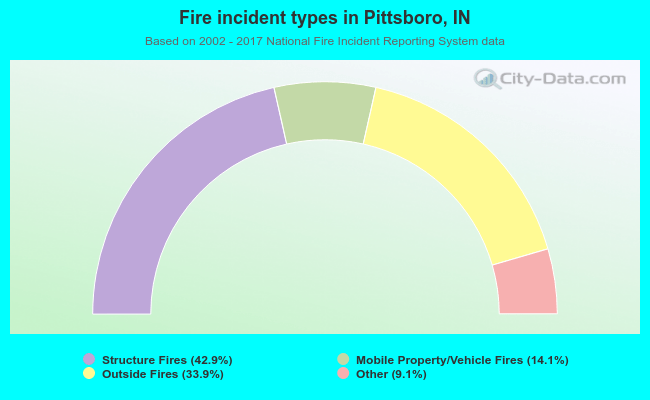 When looking into fire subcategories, the most incidents belonged to: Structure Fires (42.9%), and Outside Fires (33.9%).