| Fire incidents reported |
|---|
| Sreet name | Count |
|---|
| HIDEOUT RD | 32 | | BATESVILLE BLVD | 20 | | BATESVILLE BLVD BLVD | 16 | | HWY 87FLORAL RD HWY | 14 | | UNION HILL RD | 14 | | UNION HILL ROAD RD | 14 | | BLACKLAND RD | 12 | | HWY 157 HWY | 12 | | JACKSON COUNTY RD 6 RD | 12 | | WISH ST | 12 | | MAIN STREET STS | 10 | | BATESVILLE BLVD | 8 | | BLACKLAND RD | 8 | | CORNERSTONE ROAD RD | 8 | | FLORAL RD | 8 | | HWY 157 | 8 | | JACKSON 6 | 8 | | MAIN ST | 8 | | RANSOM SMITH RD | 8 | | 1970 FLORAL RD | 6 | | 205 WAGON WHEEL | 6 | | 6106 BATESVILLE BLVD | 6 | | 750 MAIN ST. | 6 | | BLACKLAND ROAD RD | 6 | | CLUB RD | 6 |
| | | Fire incidents reported |
|---|
| Sreet name | Count |
|---|
| FAIRVIEW DR | 6 | | HWY. 167 | 6 | | JACKSON COUNTY ROAD 197 RD | 6 | | MARTIN ROAD RD | 6 | | US HWY 167 HWY | 6 | | WILCOX RD | 6 | | 170 WISH ST | 4 | | 1925 WISH ST | 4 | | 1970 FLORAL RD. | 4 | | 2740 BLACKLAND RD | 4 | | 3240 BLACKLAND RD | 4 | | 4829 BLACKLAND RD | 4 | | 524 MARTIN RD | 4 | | 75 FRYMAN LANE | 4 | | 940 UNION HILL RD | 4 | | 970 HIDEOUT RD | 4 | | 970 HIDEOUT RD. | 4 | | CORNERSTONE RD | 4 | | EADS RD | 4 | | FISHER HILL RD | 4 | | HIGHWAY 87 HWY | 4 | | HIGHWAY 87 SOUTH HWY | 4 | | HUMPHERY DRIVE DR | 4 | | HWY 167 SOUTH | 4 | | |
|
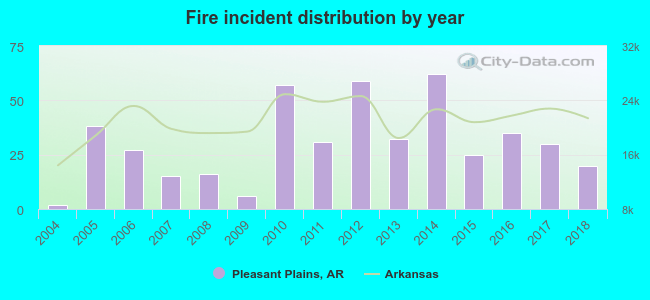 Based on the data from the years 2004 - 2018 the average number of fires per year is 30. The highest number of reported fire incidents - 62 took place in 2014, and the least - 2 in 2004. The data has an increasing trend.
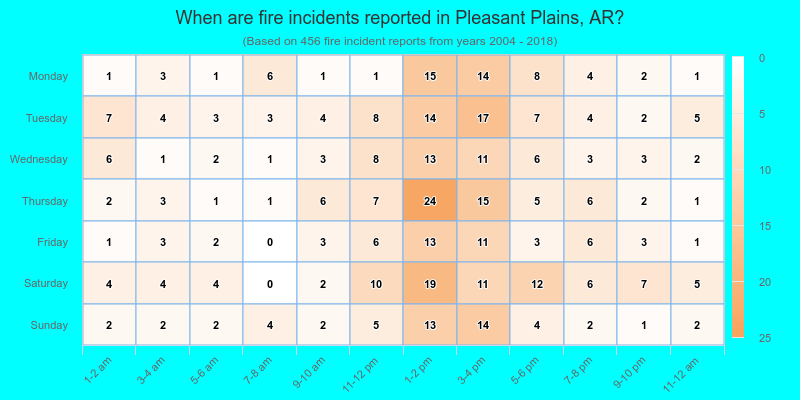
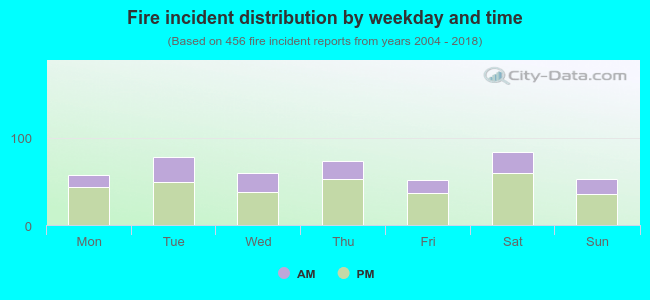 30.5% incidents where reported in the morning and 69.5% in the evening. The most fires (18.4%) took place on Saturday, and the least (11.4%) on Friday.
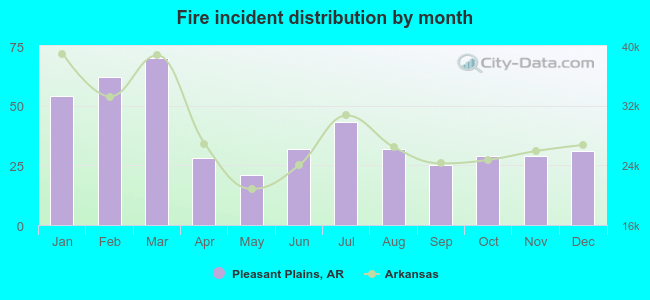 According to the 456 fires from years 2004 - 2018 most fires (15.4%) took place during March, and the least (4.6%) in May.
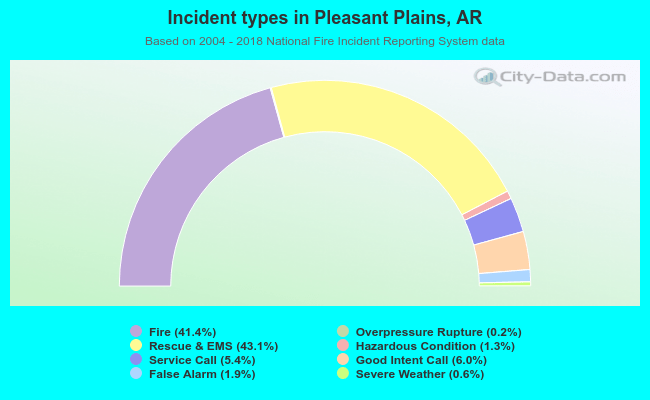 Out of all 1,101 cases reported during the years 2004 - 2018, the most belonged to the categories: Rescue & EMS (43.1%), Fire (41.4%), and Good Intent Call (6.0%).
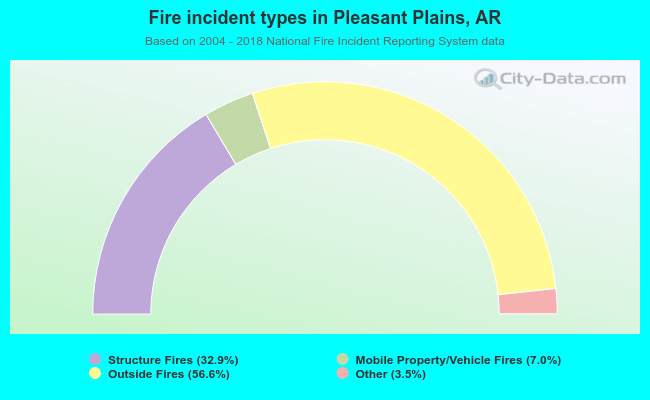 When looking into fire subcategories, the most reports belonged to: Outside Fires (56.6%), and Structure Fires (32.9%).