Plum: Fire Incidents, Pennsylvania (PA)
Where are fire incidents reported in Plum, PA
Something went wrong! Please refresh the page.
|
| |||||||||||||||||||||||||||||||||||||||||||||||||||||||||||||||||||||||||||||||||||||||||||||||||||||||||||||
2004 - 2018 National Fire Incident Reporting System (NFIRS) incidents
- Incident types reported to NFIRS in Plum, PA
- 1,51347.1%Rescue & EMS
- 49415.4%False Alarm
- 36811.5%Good Intent Call
- 34510.7%Hazardous Condition
- 34210.7%Fire
- 1033.2%Service Call
- 280.9%Special Incident
- 110.3%Severe Weather
- 60.2%Overpressure Rupture
- Fire incident types reported to NFIRS in Plum, PA
- 20559.9%Structure Fires
- 5817.0%Outside Fires
- 4112.0%Mobile Property/Vehicle Fires
- 3811.1%Other
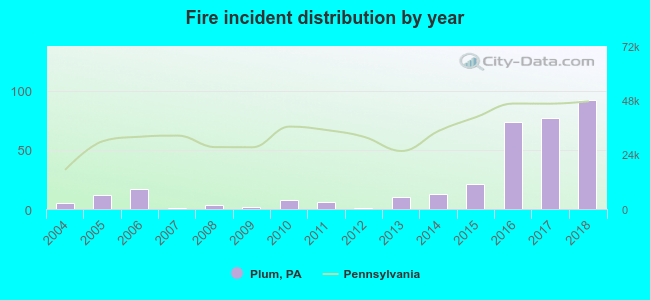 Based on the data from the years 2004 - 2018 the average number of fires per year is 23. The highest number of fires - 92 took place in 2018, and the least - 1 in 2007. The data has a rising trend.
The average number of yearly fire incidents per 10k residents in Plum, PA compared to nearest cities:
(Note: Based on data for the last 3 years, including only cities with population 5,000 and above)
| Plum: | 29.4 |
| Penn Hills: | 18.7 |
| Oakmont: | 27.5 |
| New Kensington: | 29.2 |
| Monroeville: | 27.7 |
| Murrysville: | 22.5 |
| Arnold: | 10.0 |
| Lower Burrell: | 11.6 |
| Turtle Creek: | 43.4 |
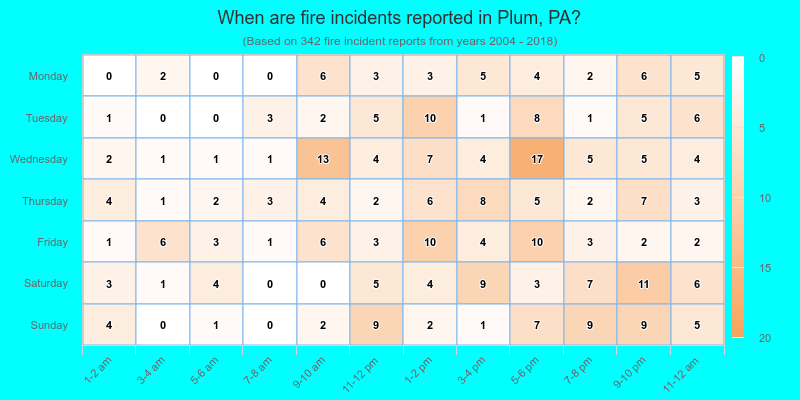
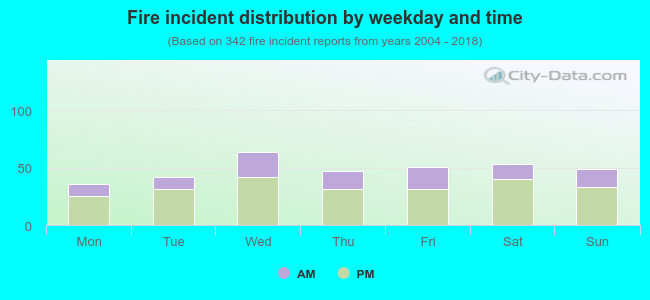 31.9% incidents where reported in the morning and 68.1% in the evening. The most fires (18.7%) took place on Wednesday, and the least (10.5%) on Monday.
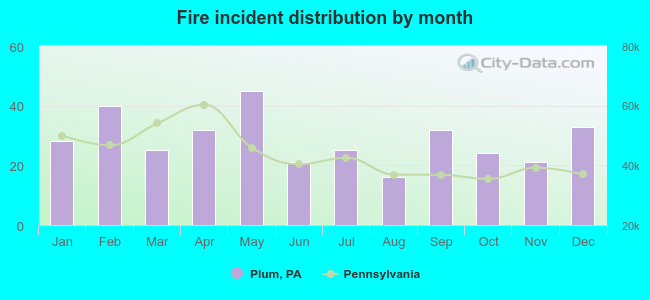 According to the 342 incident reports from years 2004 - 2018 most fires (13.2%) took place during May, and the least (4.7%) in August.
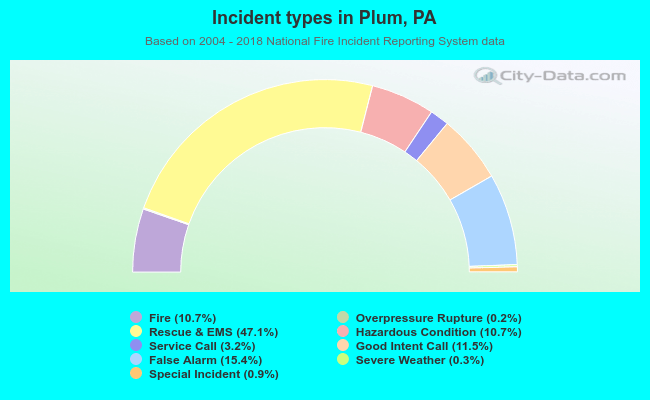 Out of all 3,210 cases reported during the years 2004 - 2018, the most belonged to the categories: Rescue & EMS (47.1%), False Alarm (15.4%), and Good Intent Call (11.5%).
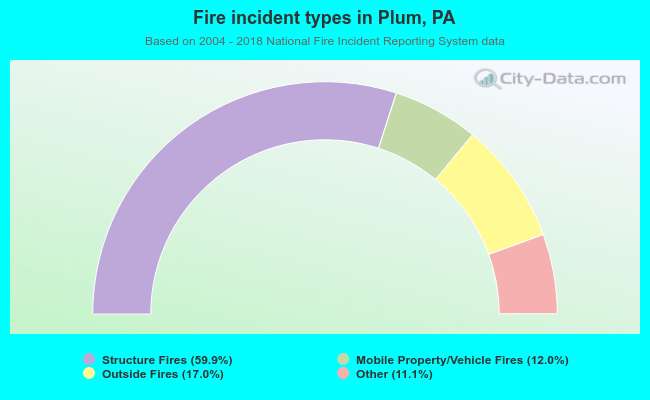 When looking into fire subcategories, the most reports belonged to: Structure Fires (59.9%), and Outside Fires (17.0%).