Plymouth Meeting: Fire Incidents, Pennsylvania (PA)
Where are fire incidents reported in Plymouth Meeting, PA
Something went wrong! Please refresh the page.
|
| |||||||||||||||||||||||||||||||||||||||||||||||||||||||||||||||||||||||||||||||||||||||||||||||||||||||||||||
2005 - 2018 National Fire Incident Reporting System (NFIRS) incidents
- Incident types reported to NFIRS in Plymouth Meeting, PA
- 16333.5%Fire
- 12425.5%False Alarm
- 8818.1%Hazardous Condition
- 5210.7%Good Intent Call
- 275.5%Rescue & EMS
- 275.5%Service Call
- 51.0%Special Incident
- 10.2%Overpressure Rupture
- Fire incident types reported to NFIRS in Plymouth Meeting, PA
- 10966.9%Structure Fires
- 3420.9%Outside Fires
- 1710.4%Mobile Property/Vehicle Fires
- 31.8%Other
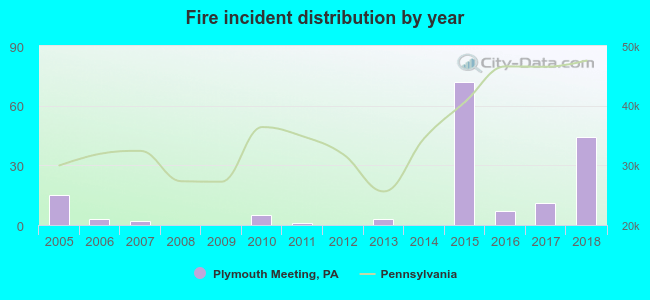 Based on the data from the years 2005 - 2018 the average number of fires per year is 12. The highest number of fires - 72 took place in 2015, and the least - 0 in 2008. The data has a rising trend.
The average number of yearly fire incidents per 10k residents in Plymouth Meeting, PA compared to nearest cities:
(Note: Based on data for the last 3 years, including only cities with population 5,000 and above)
| Plymouth Meeting: | 33.5 |
| Conshohocken: | 65.9 |
| Blue Bell: | 16.5 |
| Norristown: | 98.0 |
| East Norriton: | 30.3 |
| Ambler: | 37.4 |
| Wyndmoor: | 41.2 |
| King of Prussia: | 82.4 |
| West Norriton: | 4.1 |
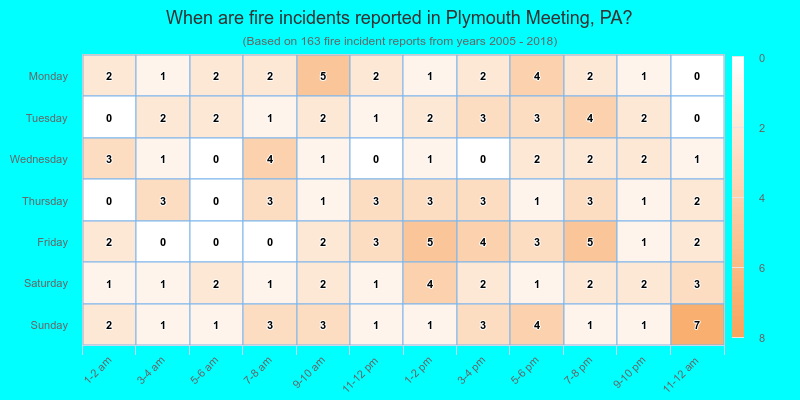
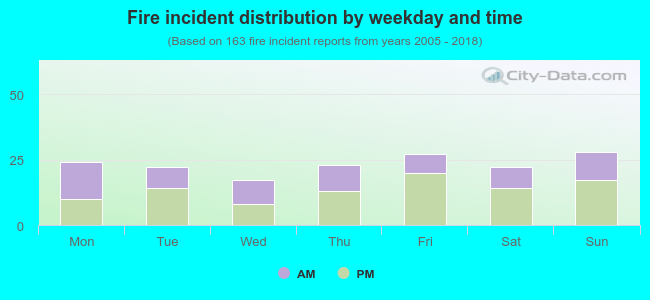 41.1% incidents where reported in the morning and 58.9% in the evening. The most fires (17.2%) took place on Sunday, and the least (10.4%) on Wednesday.
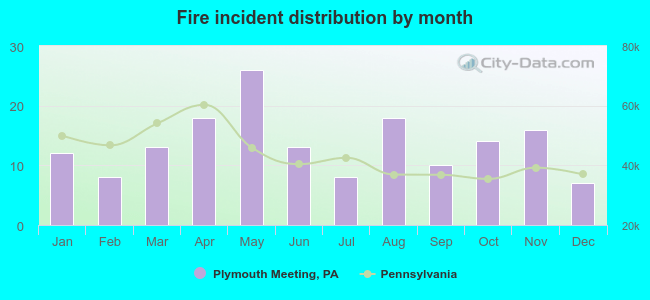 According to the 163 incident reports from years 2005 - 2018 most fires (16.0%) took place during May, and the least (4.3%) in December.
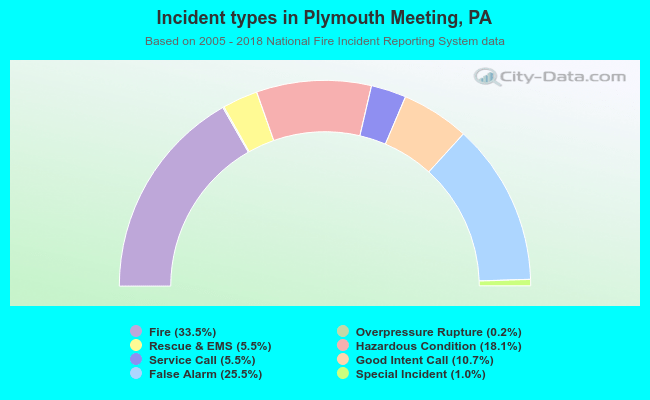 Out of all 487 cases reported during the years 2005 - 2018, the most belonged to the categories: Fire (33.5%), False Alarm (25.5%), and Hazardous Condition (18.1%).
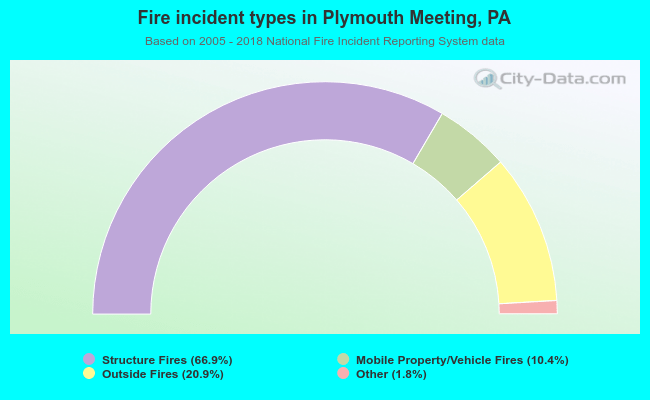 When looking into fire subcategories, the most reports belonged to: Structure Fires (66.9%), and Outside Fires (20.9%).