Port Ludlow: Fire Incidents, Washington (WA)
Where are fire incidents reported in Port Ludlow, WA
Something went wrong! Please refresh the page.
|
| |||||||||||||||||||||||||||||||||||||||||||||||||||||||||||||||||||||||||||||||||||||||||||||||||||||||||||||
2002 - 2018 National Fire Incident Reporting System (NFIRS) incidents
- Incident types reported to NFIRS in Port Ludlow, WA
- 2,86162.1%Rescue & EMS
- 49210.7%Good Intent Call
- 4329.4%Fire
- 3547.7%Service Call
- 2625.7%Hazardous Condition
- 1793.9%False Alarm
- 130.3%Special Incident
- 90.2%Severe Weather
- Fire incident types reported to NFIRS in Port Ludlow, WA
- 17841.2%Outside Fires
- 16939.1%Structure Fires
- 6715.5%Mobile Property/Vehicle Fires
- 184.2%Other
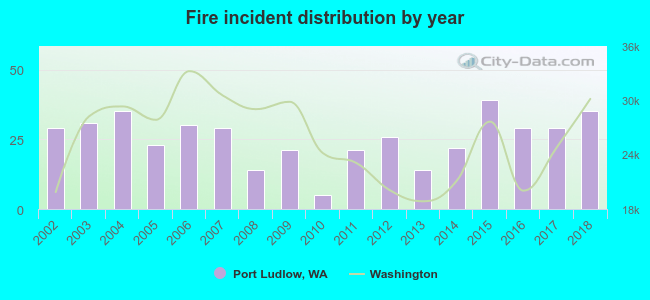 Based on the data from the years 2002 - 2018 the average number of fires per year is 25. The highest number of fires - 39 took place in 2015, and the least - 5 in 2010. The data has a growing trend.
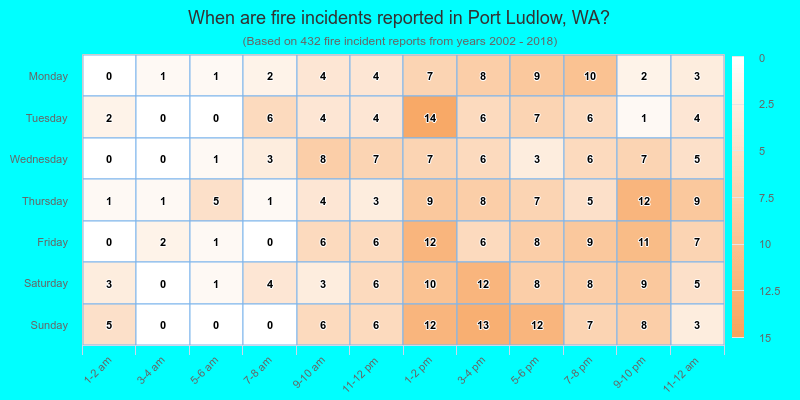
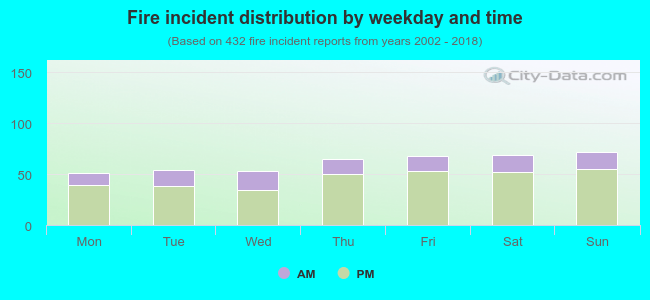 25.7% incidents where reported in the morning and 74.3% in the evening. The most fires (16.7%) took place on Sunday, and the least (11.8%) on Monday.
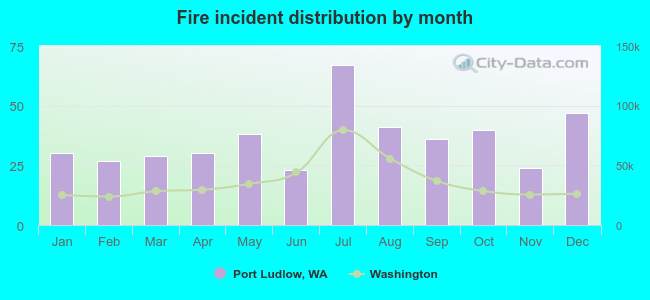 Based on the 432 reports from years 2002 - 2018 most fires (15.5%) took place during July, and the least (5.3%) in June.
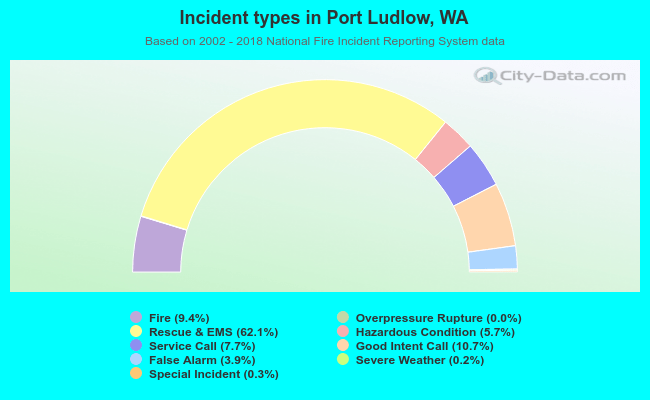 Out of all 4,604 cases reported during the years 2002 - 2018, the most belonged to the categories: Rescue & EMS (62.1%), Good Intent Call (10.7%), and Fire (9.4%).
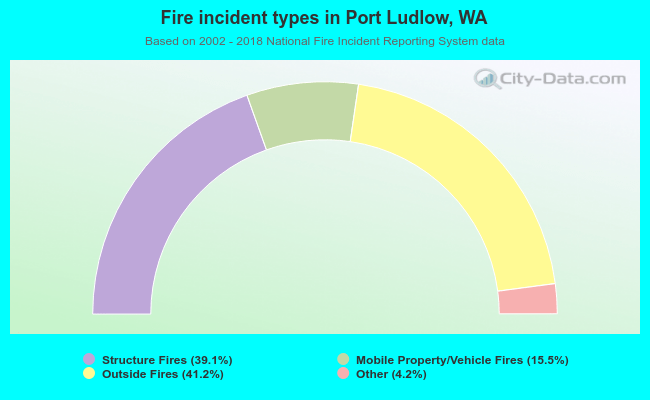 When looking into fire subcategories, the most incidents belonged to: Outside Fires (41.2%), and Structure Fires (39.1%).