Port Royal: Fire Incidents, South Carolina (SC)
Where are fire incidents reported in Port Royal, SC
Something went wrong! Please refresh the page.
|
| |||||||||||||||||||||||||||||||||||||||||||||||||||||||||||||||||||||||||||||||||||||||||||||||||||||||||||||
2004 - 2018 National Fire Incident Reporting System (NFIRS) incidents
- Incident types reported to NFIRS in Port Royal, SC
- 2,32662.9%Rescue & EMS
- 39010.6%Service Call
- 2927.9%False Alarm
- 2446.6%Good Intent Call
- 2185.9%Fire
- 2175.9%Hazardous Condition
- 50.1%Overpressure Rupture
- Fire incident types reported to NFIRS in Port Royal, SC
- 13361.0%Structure Fires
- 4319.7%Outside Fires
- 2812.8%Mobile Property/Vehicle Fires
- 146.4%Other
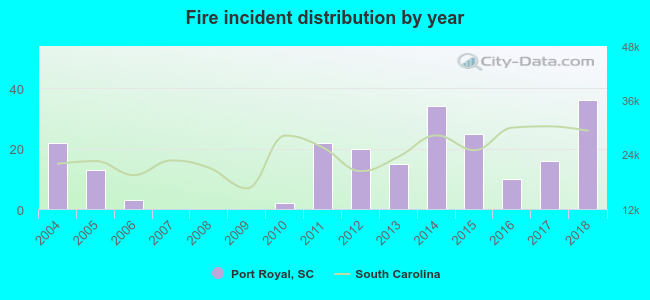 Based on the data from the years 2004 - 2018 the average number of fire incidents per year is 15. The highest number of fire incidents - 36 took place in 2018, and the least - 0 in 2007. The data has a rising trend.
The average number of yearly fire incidents per 10k residents in Port Royal, SC compared to nearest cities:
(Note: Based on data for the last 3 years, including only cities with population 5,000 and above)
| Port Royal: | 17.4 |
| Beaufort: | 47.2 |
| Burton: | 31.1 |
| Hilton Head Island: | 31.6 |
| Bluffton: | 95.0 |
| Walterboro: | 425.4 |
| Johns Island: | 104.5 |
| James Island: | 12.7 |
| Charleston: | 56.7 |
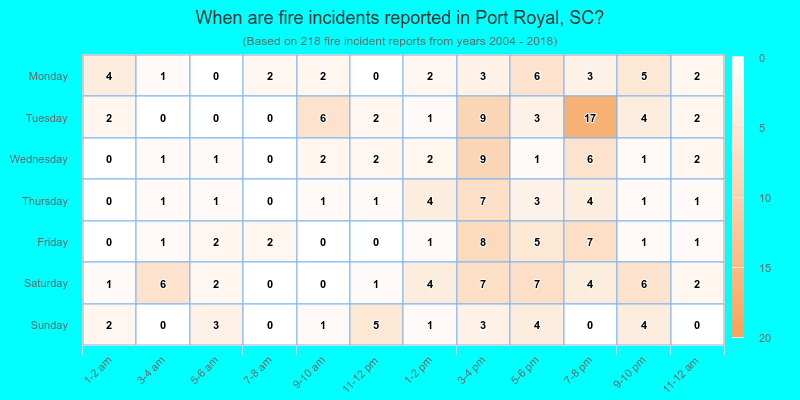
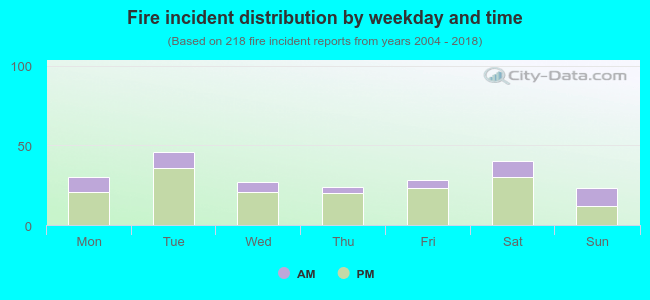 25.2% incidents where reported in the morning and 74.8% in the evening. The most fires (21.1%) took place on Tuesday, and the least (10.6%) on Sunday.
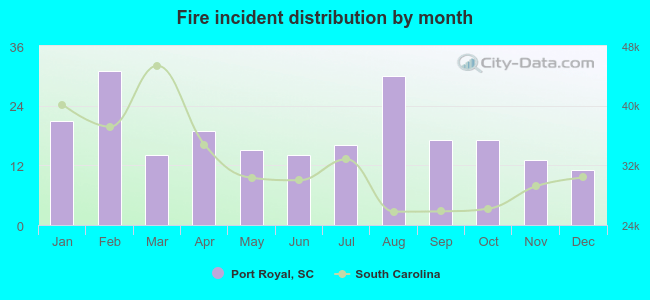 According to the 218 reports from years 2004 - 2018 most fires (14.2%) took place during February, and the least (5.0%) in December.
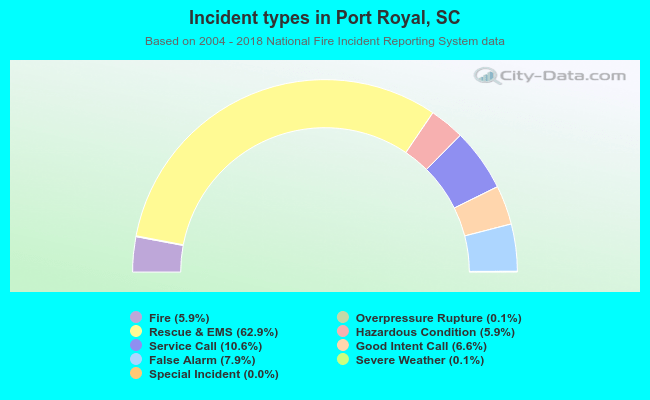 Out of all 3,696 cases reported during the years 2004 - 2018, the most belonged to the categories: Rescue & EMS (62.9%), Service Call (10.6%), and False Alarm (7.9%).
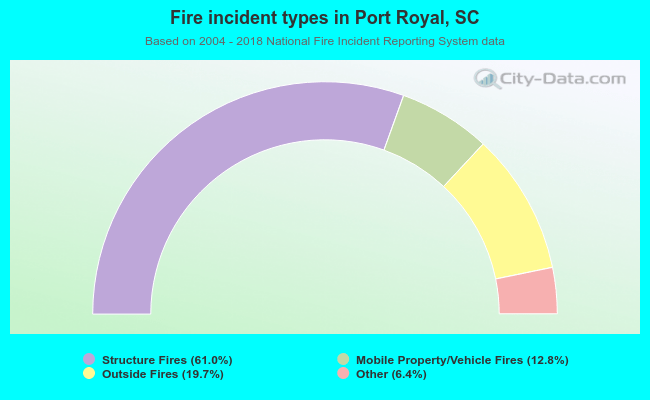 When looking into fire subcategories, the most incidents belonged to: Structure Fires (61.0%), and Outside Fires (19.7%).