Portage: Fire Incidents, Indiana (IN)
Where are fire incidents reported in Portage, IN
Something went wrong! Please refresh the page.
| Fire incidents reported | |
|---|---|
| Sreet name | Count |
| CAMELOT | 106 |
| US 6 HWY | 94 |
| OLD PORTER RD | 86 |
| CENTRAL AVE | 70 |
| US 12 HWY | 66 |
| WILLOWCREEK RD | 62 |
| US 20 HWY | 60 |
| OLD PORTER | 52 |
| US 6 | 48 |
| WILLOWCREEK | 40 |
| CENTRAL | 38 |
| EVERGREEN AVE | 32 |
| US 20 | 32 |
| TOLL ROAD | 28 |
| US HWY 6 | 26 |
| I-94 HWY | 24 |
| STAGECOACH RD | 24 |
| TOLL ROAD HWY | 24 |
| CLEM RD | 22 |
| HICKORY | 22 |
| I94 HWY | 22 |
| LIGHTHOUSE | 22 |
| MULBERRY AVE | 22 |
| WILLOWDALE | 22 |
| LUTE RD | 20 |
| US HWY 12 | 20 |
| COUNTY LINE RD | 18 |
| SAMUELSON RD | 18 |
| US 12 | 18 |
| WILLOWDALE RD | 16 |
| Other | 637 |
2002 - 2017 National Fire Incident Reporting System (NFIRS) incidents
- Incident types reported to NFIRS in Portage, IN
- 8,15259.8%Rescue & EMS
- 1,79113.1%Fire
- 1,3379.8%Hazardous Condition
- 9687.1%Service Call
- 7755.7%Good Intent Call
- 5394.0%False Alarm
- 420.3%Special Incident
- 270.2%Overpressure Rupture
- Fire incident types reported to NFIRS in Portage, IN
- 72140.3%Structure Fires
- 58532.7%Outside Fires
- 36820.5%Mobile Property/Vehicle Fires
- 1176.5%Other
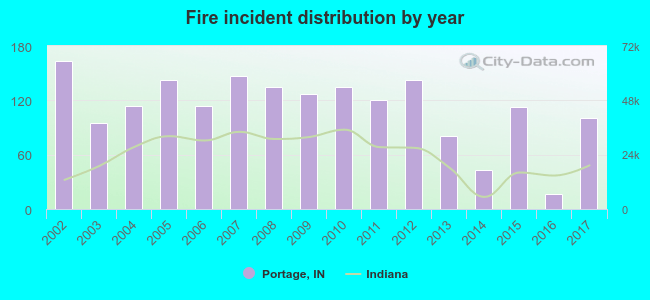 According to the data from the years 2002 - 2017 the average number of fires per year is 112. The highest number of reported fire incidents - 163 took place in 2002, and the least - 17 in 2016. The data has a declining trend.
The average number of yearly fire incidents per 10k residents in Portage, IN compared to nearest cities:
(Note: Based on data for the last 3 years, including only cities with population 5,000 and above)
| Portage: | 16.1 |
| South Haven: | 8.5 |
| Lake Station: | 22.2 |
| Hobart: | 1.4 |
| Chesterton: | 21.4 |
| Gary: | 11.3 |
| Valparaiso: | 30.9 |
| Merrillville: | 23.5 |
| Griffith: | 3.6 |
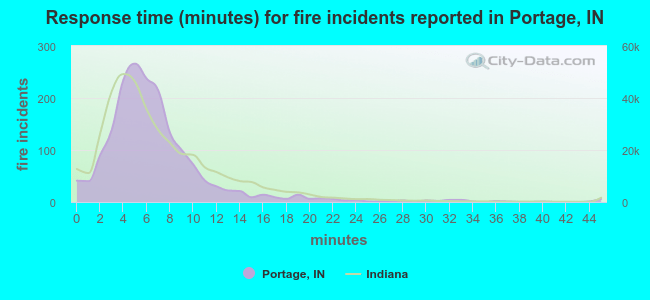 The median response time based on all reported fire incidents is 6 minutes. This is close to the state median value.
The median response time in Portage, IN compared to nearest cities:
(Note: Based on data for all years, including only cities with at least 500 fire incidents)
| Portage: | 6 minutes |
| Lake Station: | 7 minutes |
| Hobart: | 5 minutes |
| Chesterton: | 6 minutes |
| Gary: | 5 minutes |
| Valparaiso: | 6 minutes |
| Merrillville: | 5 minutes |
| Crown Point: | 6 minutes |
| Highland: | 7 minutes |
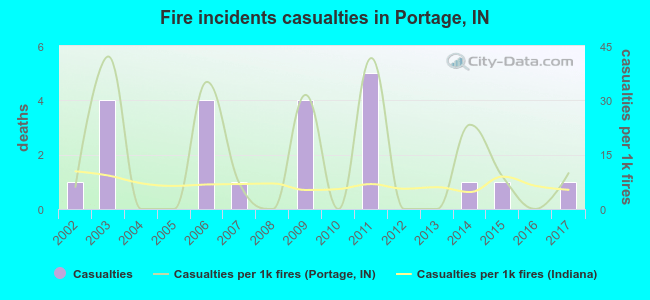 Based on the reports from the years 2002 - 2017 the average number of fire-related casualties per year is 1. The highest number of injuries - 5 took place in 2011, and the lowest - 0 in 2004. The data has a constant trend.
The average number of casualties per 1,000 fire incidents is 13. This indicator was the highest - 42 in 2003, and the lowest 0 in 2004. The trend for casualties per 1,000 incidents is increasing. Compared to the state value the number of casualties per 1,000 fire incidents is higher.
Based on the reports from the years 2002 - 2017 the average number of fire-related casualties per year is 1. The highest number of injuries - 5 took place in 2011, and the lowest - 0 in 2004. The data has a constant trend.
The average number of casualties per 1,000 fire incidents is 13. This indicator was the highest - 42 in 2003, and the lowest 0 in 2004. The trend for casualties per 1,000 incidents is increasing. Compared to the state value the number of casualties per 1,000 fire incidents is higher.Casualties per 1,000 incidents in Portage, IN compared to nearest cities:
(Note: Based on data for all years, including only cities with at least 500 fire incidents)
| Portage: | 12.3 |
| Lake Station: | 1.9 |
| Hobart: | 16.3 |
| Chesterton: | 1.6 |
| Gary: | 2.4 |
| Valparaiso: | 5.0 |
| Merrillville: | 6.6 |
| Crown Point: | 1.4 |
| Highland: | 4.2 |
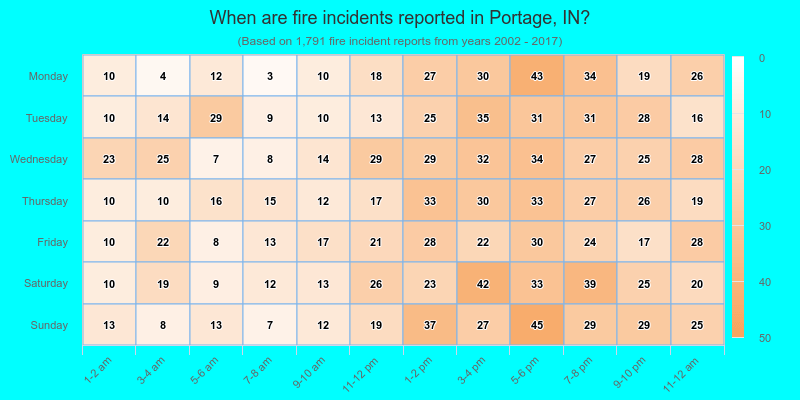
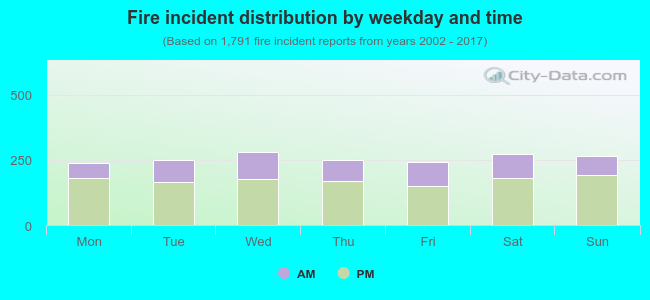 32.4% incidents where reported in the morning and 67.6% in the evening. The most fires (15.7%) took place on Wednesday, and the least (13.2%) on Monday.
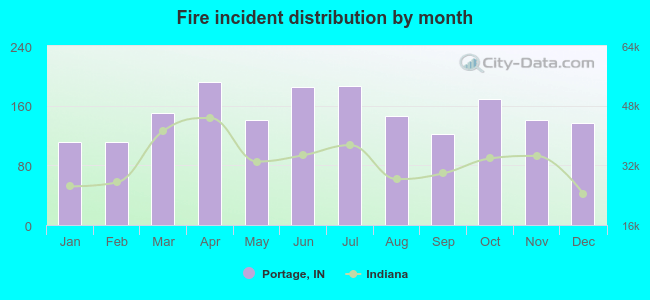 Based on the 1,791 fire incidents from years 2002 - 2017 most fires (10.7%) took place during April, and the least (6.2%) in January.
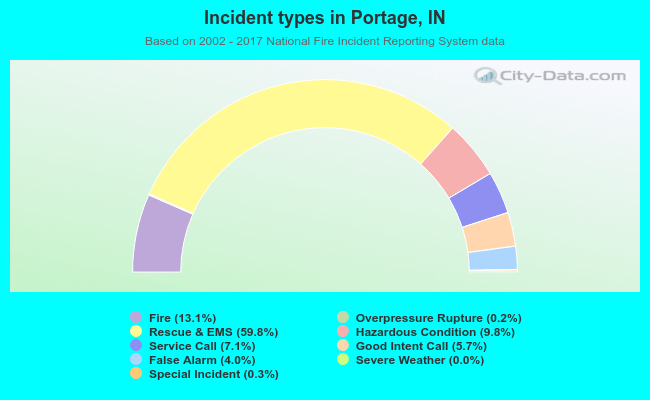 Out of all 13,637 cases reported during the years 2002 - 2017, the most belonged to the categories: Rescue & EMS (59.8%), Fire (13.1%), and Hazardous Condition (9.8%).
 When looking into fire subcategories, the most reports belonged to: Structure Fires (40.3%), and Outside Fires (32.7%).