Portola Valley: Fire Incidents, California (CA)
Where are fire incidents reported in Portola Valley, CA
Something went wrong! Please refresh the page.
|
| |||||||||||||||||||||||||||||||||||||||||||||||||||||||||||||||||||||||||||||||||||||||||||||||||||||||||||||
2005 - 2018 National Fire Incident Reporting System (NFIRS) incidents
- Incident types reported to NFIRS in Portola Valley, CA
- 1,28949.0%Rescue & EMS
- 37014.1%False Alarm
- 33212.6%Service Call
- 2599.8%Hazardous Condition
- 2429.2%Good Intent Call
- 1294.9%Fire
- 60.2%Overpressure Rupture
- 60.2%Severe Weather
- Fire incident types reported to NFIRS in Portola Valley, CA
- 5945.7%Outside Fires
- 4736.4%Structure Fires
- 1814.0%Mobile Property/Vehicle Fires
- 53.9%Other
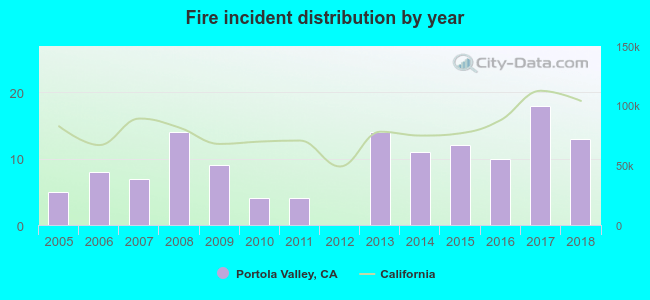 According to the data from the years 2005 - 2018 the average number of fires per year is 9. The highest number of reported fires - 18 took place in 2017, and the least - 0 in 2012. The data has a rising trend.
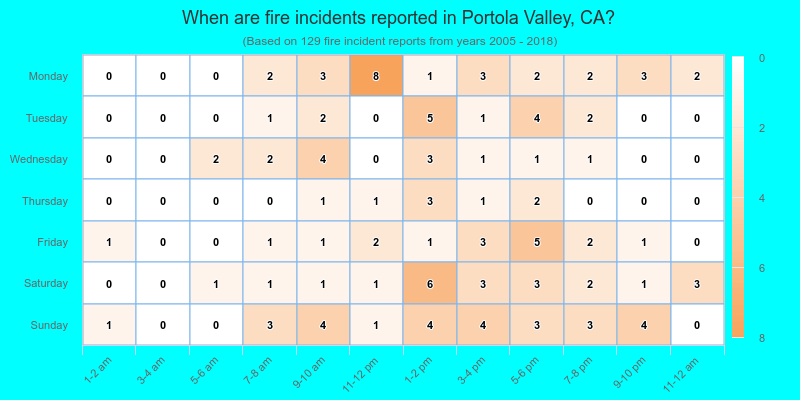
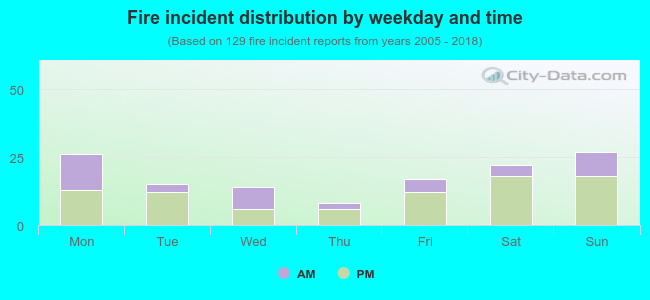 34.1% incidents where reported in the morning and 65.9% in the evening. The most fires (20.9%) took place on Sunday, and the least (6.2%) on Thursday.
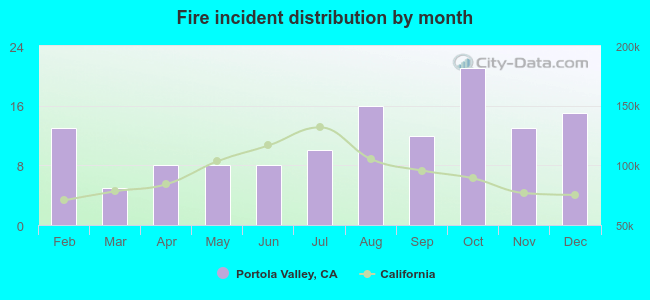 According to the 129 fire incidents from years 2005 - 2018 most fires (16.3%) took place during October, and the least (3.9%) in March.
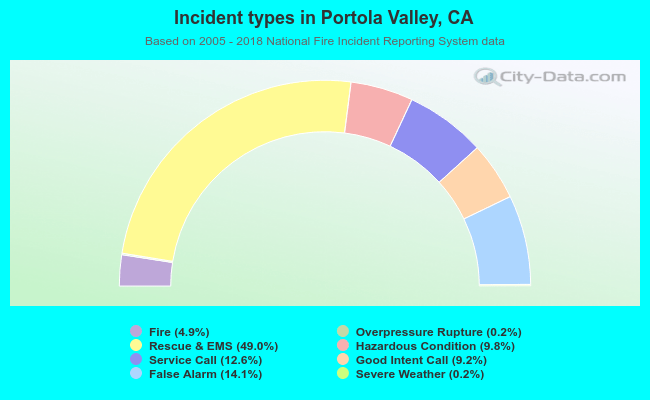 Out of all 2,633 cases reported during the years 2005 - 2018, the most belonged to the categories: Rescue & EMS (49.0%), False Alarm (14.1%), and Service Call (12.6%).
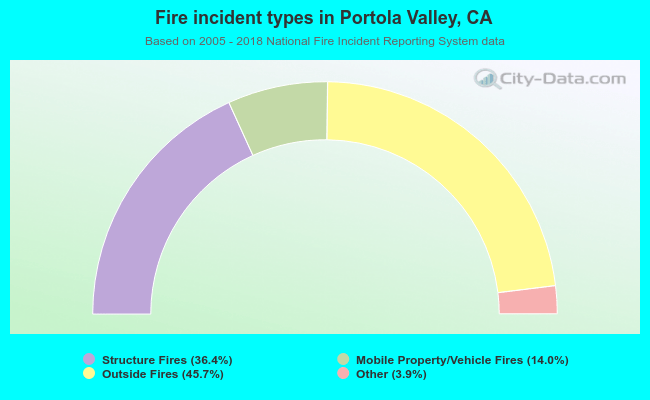 When looking into fire subcategories, the most incidents belonged to: Outside Fires (45.7%), and Structure Fires (36.4%).