| Fire incidents reported |
|---|
| Sreet name | Count |
|---|
| M-65 | 14 | | 11729 ALPENA RD | 8 | | CLINTON LAKE HWY | 8 | | LONG LAKE HWY | 8 | | 8362 M65 | 6 | | CARR RD | 6 | | DONALD RD | 6 | | LEER RD | 6 | | METZ | 6 | | MICHIGAN AVE | 6 | | 12996 URBAN RD | 4 | | 7427 OAK ST | 4 | | 7539 ELM | 4 | | 9393 PUROL HWY | 4 | | 9555 LEER RD | 4 | | 9977 CLINTON LAKE RD | 4 | | ALPENA RD | 4 | | BOLTON RD | 4 | | ENGER RD | 4 | | GRAND LAKE HWY | 4 | | GRAND LAKE HWY | 4 | | GRAND LAKE RD | 4 | | KENSA RD | 4 | | LEER RD | 4 | | LONG LAKE HWY | 4 |
| | | Fire incidents reported |
|---|
| Sreet name | Count |
|---|
| M-65 HWY | 4 | | METZ HWY | 4 | | OAK ST | 4 | | PUROL HWY | 4 | | THUNDER BAY HWY | 4 | | 10062 MILLER LANE | 2 | | 10267 BASSWOOD RD | 2 | | 10347 CLINTON LAKE HWY | 2 | | 10427 M-65 | 2 | | 10602 MICHIGAN AVE | 2 | | 10685 MICHIGAN AVE. | 2 | | 11011 MICHIGAN AVE | 2 | | 11177 634 HWY | 2 | | 11177 POLASKI RD | 2 | | 1118 634 HWY | 2 | | 11352 PULASKI RD | 2 | | 11688 LEER RD | 2 | | 12032 GRAND LAKE RD | 2 | | 12113 FINELY RD | 2 | | 12113 FINLEY HWY | 2 | | 12113 FINLEY RD | 2 | | 12567 BUZA RD | 2 | | 12594 BLENK | 2 | | 13118 ENGER RD | 2 | | |
|
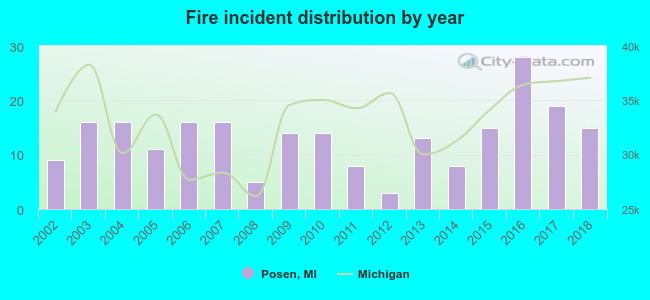 According to the data from the years 2002 - 2018 the average number of fire incidents per year is 13. The highest number of reported fires - 28 took place in 2016, and the least - 3 in 2012. The data has a growing trend.
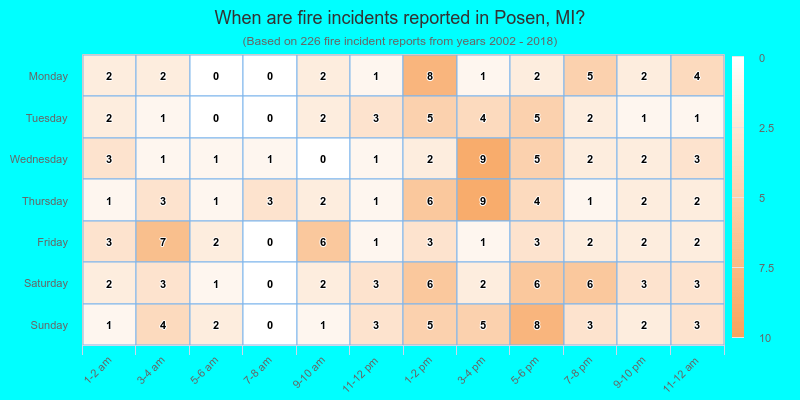
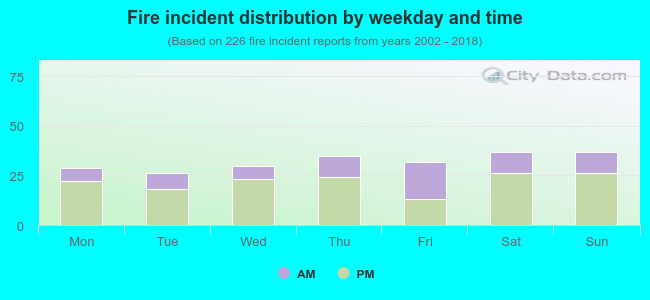 32.7% incidents where reported in the morning and 67.3% in the evening. The most fires (16.4%) took place on Saturday, and the least (11.5%) on Tuesday.
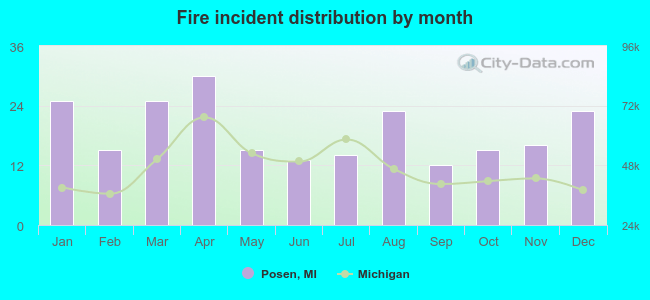 Based on the 226 fire incident reports from years 2002 - 2018 most fires (13.3%) took place during April, and the least (5.3%) in September.
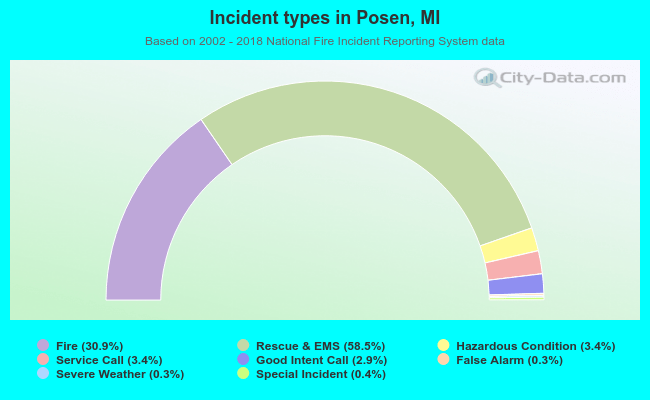 Out of all 732 cases reported during the years 2002 - 2018, the most belonged to the categories: Overpressure Rupture (58.5%), Fire (30.9%), and Rescue & EMS (3.4%).
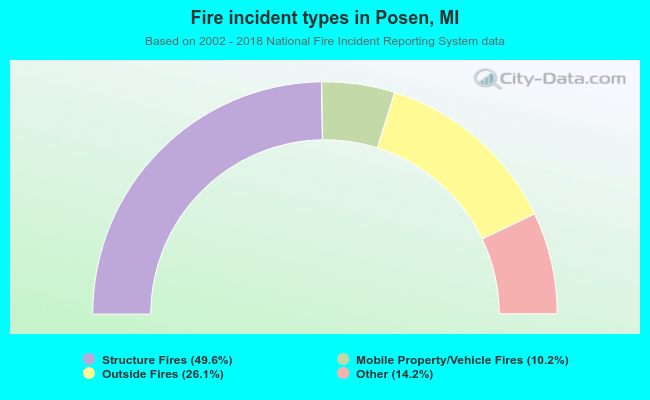 When looking into fire subcategories, the most incidents belonged to: Structure Fires (49.6%), and Outside Fires (26.1%).