| Fire incidents reported |
|---|
| Sreet name | Count |
|---|
| HEBER SPRINGS RD | 44 | | STACY SPRINGS RD | 38 | | EDGEMONT RD | 34 | | MILLER POINT RD | 26 | | COVE CREEK RD | 20 | | WESLEY CHAPEL RD | 18 | | CROSSROADS | 14 | | DIAMOND BLUFF RD | 14 | | PEARSON RD | 14 | | PLEASANT SPRINGS RD | 14 | | NEW HOME RD | 12 | | CHRISTOPHER DR | 10 | | HEBER SPRINGS RD W | 10 | | OLD SPRINGFIELD RD | 10 | | SAWMILL RD | 10 | | 25 HWY | 8 | | BEE BRANCH RD | 8 | | FIREHOUSE RD | 8 | | HWY 124 | 8 | | ROSEBUD RD | 8 | | ADAMS RD | 6 | | BETTIS MOUNTAIN RD | 6 | | BIVENS RD | 6 | | CA HOLLAND RD | 6 | | CADRON CREEK RD | 6 |
| | | Fire incidents reported |
|---|
| Sreet name | Count |
|---|
| DAMASCUS RD | 6 | | FREEMAN LN | 6 | | HEBER SPRINGS RDS | 6 | | NEW HOME RD | 6 | | SARTIN RD | 6 | | TODD RD | 6 | | 18 FAIRVIEW RD | 4 | | 233 NEW HOME RD | 4 | | 740 HWY 25N | 4 | | CACTUS CREEK RD | 4 | | CHAPEL LAKE CIR | 4 | | CHAPEL LAKE LN | 4 | | COUNTRY SIDE DR | 4 | | COVE CREEK | 4 | | ELM ST | 4 | | FAIRVIEW RD | 4 | | GUY LN | 4 | | HARGETT RD | 4 | | HEBER SPRINGS RD | 4 | | HWY 107 | 4 | | HWY 25 | 4 | | NEW ST | 4 | | PITT RD | 4 | | PLEASANT SPRINGS ROAD | 4 | | PUMPKIN CENTER CIRCLE | 4 |
|
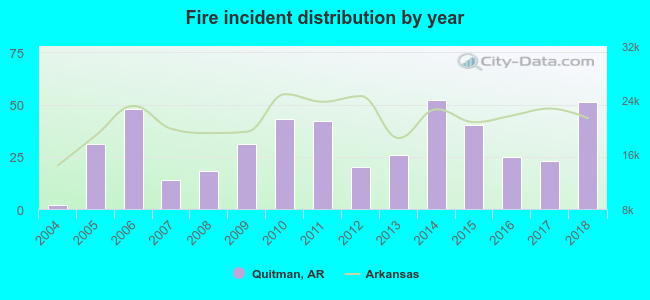 According to the data from the years 2004 - 2018 the average number of fires per year is 31. The highest number of fire incidents - 52 took place in 2014, and the least - 2 in 2004. The data has an increasing trend.
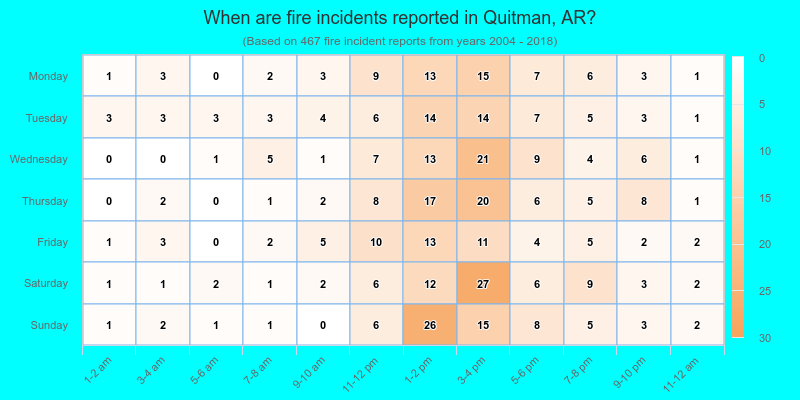
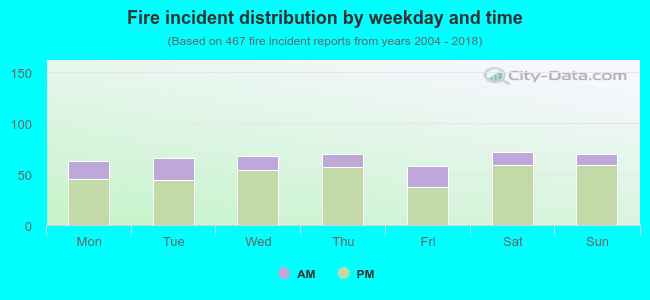 24.0% incidents where reported in the morning and 76.0% in the evening. The most fires (15.4%) took place on Saturday, and the least (12.4%) on Friday.
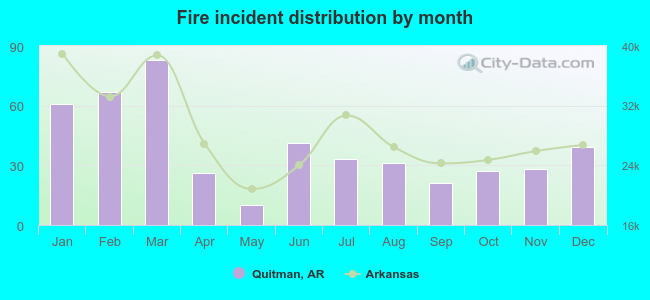 According to the 467 fire incidents from years 2004 - 2018 most fires (17.8%) took place during March, and the least (2.1%) in May.
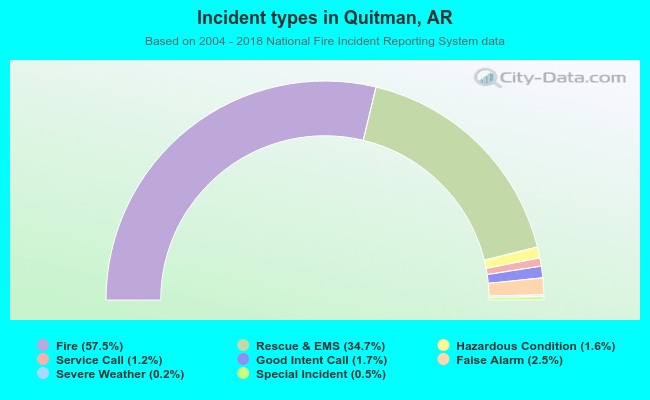 Out of all 812 cases reported during the years 2004 - 2018, the most belonged to the categories: Fire (57.5%), Overpressure Rupture (34.7%), and Good Intent Call (2.5%).
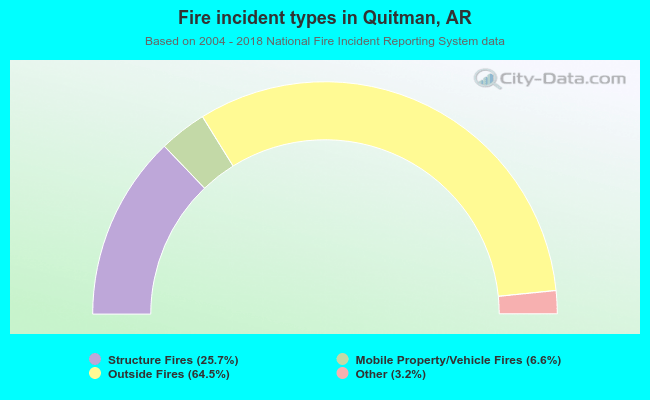 When looking into fire subcategories, the most reports belonged to: Outside Fires (64.5%), and Structure Fires (25.7%).