Raytown: Fire Incidents, Missouri (MO)
Where are fire incidents reported in Raytown, MO
Something went wrong! Please refresh the page.
| Fire incidents reported | |
|---|---|
| Sreet name | Count |
| RAYTOWN RD | 60 |
| BLUE RIDGE BLVD | 58 |
| 63RD ST | 42 |
| 61ST ST | 40 |
| 350 HWY | 34 |
| LANE | 30 |
| STERLING | 28 |
| 83RD ST | 24 |
| UTOPIA DR | 24 |
| WOODSON | 22 |
| 59TH ST | 20 |
| 67TH ST | 20 |
| 87TH ST | 20 |
| 65TH TER | 16 |
| HIDDEN LAKE DR | 16 |
| KENTUCKY AVE | 16 |
| STERLING AVE | 16 |
| WOODSON DR | 16 |
| 84TH ST | 14 |
| HARRIS | 14 |
| HUNTER | 14 |
| RALSTON | 14 |
| 66TH ST | 12 |
| HEDGES | 12 |
| 53RD ST | 10 |
| 69TH TER | 10 |
| 71ST TER | 10 |
| 74TH ST | 10 |
| 75TH ST | 10 |
| 79TH ST | 10 |
| Other | 8 |
2004 - 2018 National Fire Incident Reporting System (NFIRS) incidents
- Incident types reported to NFIRS in Raytown, MO
- 4,61059.3%Rescue & EMS
- 80310.3%Good Intent Call
- 7699.9%Hazardous Condition
- 6938.9%Service Call
- 6508.4%Fire
- 2112.7%False Alarm
- 230.3%Special Incident
- Fire incident types reported to NFIRS in Raytown, MO
- 30847.4%Structure Fires
- 21332.8%Outside Fires
- 9915.2%Mobile Property/Vehicle Fires
- 304.6%Other
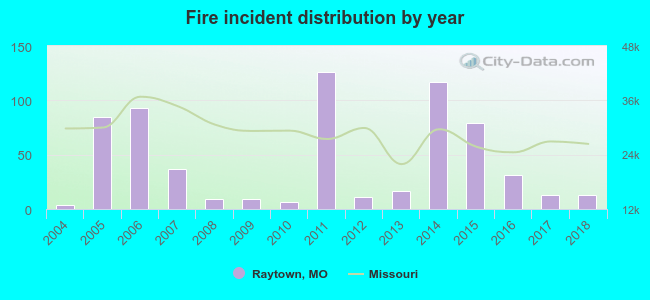 Based on the data from the years 2004 - 2018 the average number of fire incidents per year is 43. The highest number of fires - 126 took place in 2011, and the least - 4 in 2004. The data has a growing trend.
The average number of yearly fire incidents per 10k residents in Raytown, MO compared to nearest cities:
(Note: Based on data for the last 3 years, including only cities with population 5,000 and above)
| Raytown: | 6.4 |
| Independence: | 40.0 |
| Kansas City: | 38.0 |
| Grandview: | 44.0 |
| Blue Springs: | 19.5 |
| Greenwood: | 23.1 |
| Belton: | 34.0 |
| Raymore: | 10.5 |
| Grain Valley: | 22.4 |
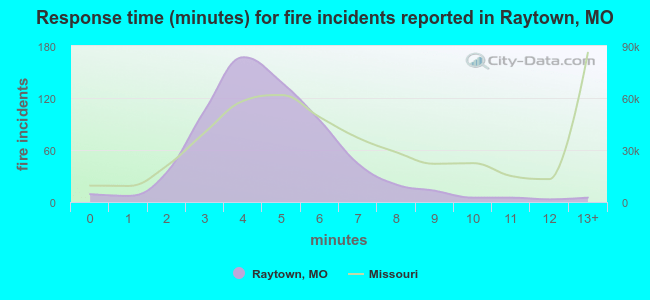 The median response time based on all reported fire incidents is 5 minutes. This is lower than the Missouri median value.
The median response time in Raytown, MO compared to nearest cities:
(Note: Based on data for all years, including only cities with at least 500 fire incidents)
| Raytown: | 5 minutes |
| Independence: | 5 minutes |
| Lee's Summit: | 6 minutes |
| Kansas City: | 5 minutes |
| Grandview: | 5 minutes |
| Leawood: | 5 minutes |
| Blue Springs: | 5 minutes |
| North Kansas City: | 4 minutes |
| Overland Park: | 6 minutes |
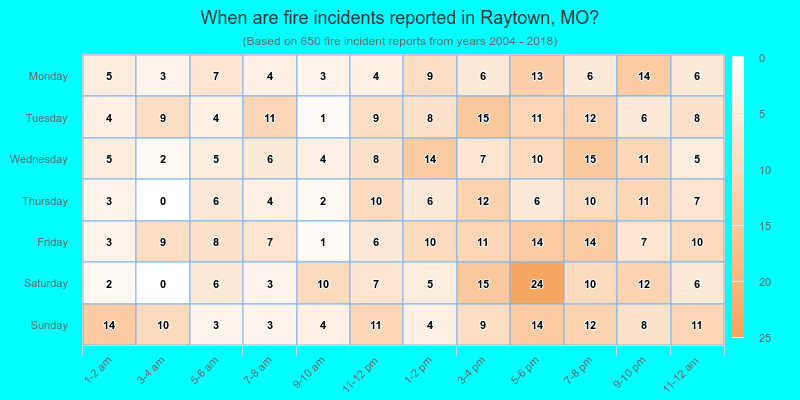
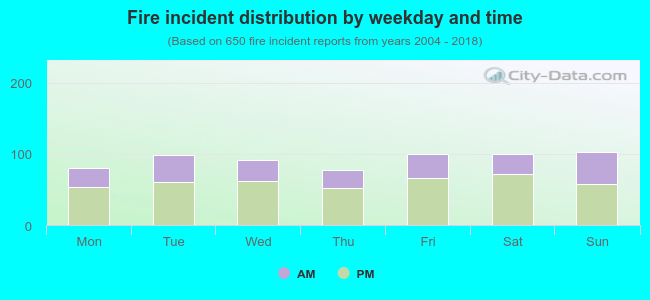 34.8% incidents where reported in the morning and 65.2% in the evening. The most fires (15.8%) took place on Sunday, and the least (11.8%) on Thursday.
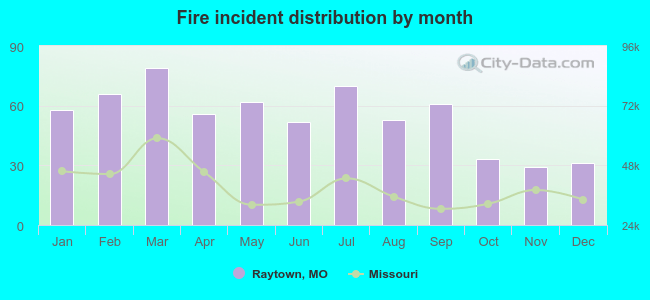 Based on the 650 fires from years 2004 - 2018 most fires (12.2%) took place during March, and the least (4.5%) in November.
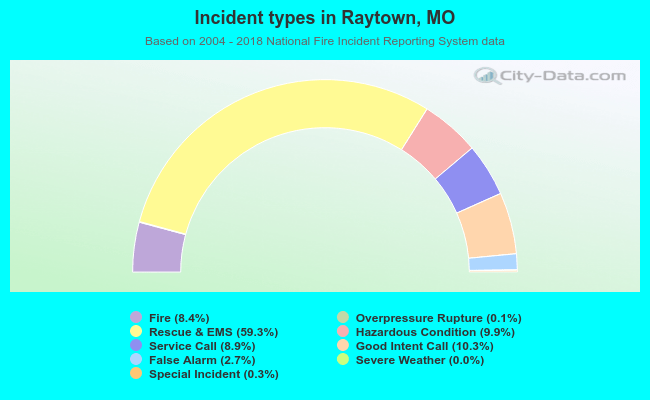 Out of all 7,768 cases reported during the years 2004 - 2018, the most belonged to the categories: Rescue & EMS (59.3%), Good Intent Call (10.3%), and Hazardous Condition (9.9%).
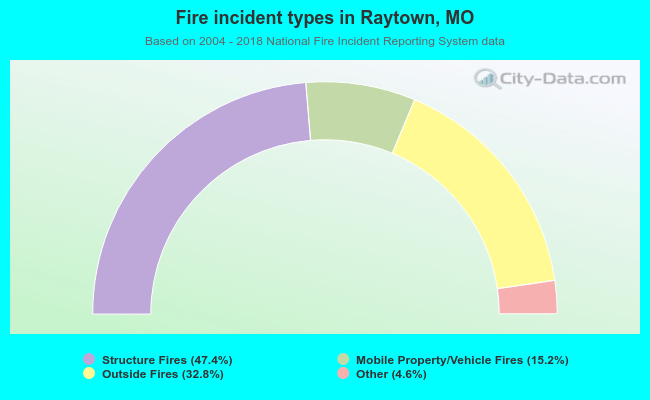 When looking into fire subcategories, the most incidents belonged to: Structure Fires (47.4%), and Outside Fires (32.8%).