Revere: Fire Incidents, Massachusetts (MA)
Where are fire incidents reported in Revere, MA
Something went wrong! Please refresh the page.
| Fire incidents reported | |
|---|---|
| Sreet name | Count |
| SQUIRE RD | 946 |
| BROADWAY | 850 |
| WALNUT AVE | 632 |
| REVERE BEACH BLVD | 498 |
| OCEAN AVE | 452 |
| BEACH ST | 416 |
| REVERE ST | 372 |
| SHIRLEY AVE | 360 |
| LANTERN RD | 338 |
| NORTH SHORE RD | 262 |
| PARK AVE | 236 |
| WARD ST | 220 |
| WINTHROP AVE | 186 |
| REVERE BEACH | 170 |
| REVERE BEACH PKY | 162 |
| CHARGER ST | 148 |
| MALDEN ST | 142 |
| PROCTOR AVE | 128 |
| BENNINGTON ST | 126 |
| AMERICAN LEGION HWY | 124 |
| LEE BURBANK HWY | 122 |
| MCCOBA ST | 122 |
| WASHINGTON AVE | 122 |
| HIGHLAND ST | 120 |
| THORNTON ST | 120 |
| COOLEDGE ST | 116 |
| ATLANTIC AVE | 104 |
| DOLPHIN AVE | 98 |
| CAMPBELL AVE | 92 |
| RESERVOIR AVE | 88 |
2002 - 2018 National Fire Incident Reporting System (NFIRS) incidents
- Incident types reported to NFIRS in Revere, MA
- 38,27560.3%Rescue & EMS
- 6,49710.2%Fire
- 6,1799.7%Service Call
- 5,4278.6%False Alarm
- 3,7315.9%Hazardous Condition
- 2,8954.6%Good Intent Call
- 3500.6%Special Incident
- Fire incident types reported to NFIRS in Revere, MA
- 4,65871.7%Structure Fires
- 1,10417.0%Outside Fires
- 3775.8%Mobile Property/Vehicle Fires
- 3585.5%Other
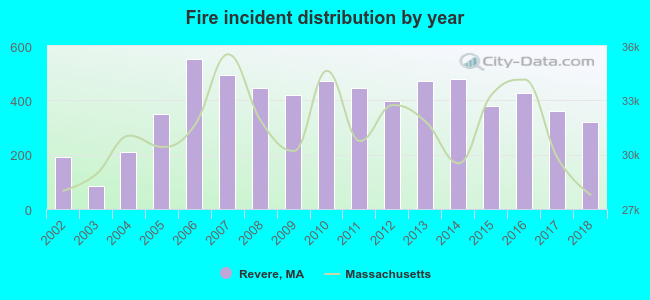 Based on the data from the years 2002 - 2018 the average number of fire incidents per year is 382. The highest number of reported fires - 551 took place in 2006, and the least - 84 in 2003. The data has a growing trend.
The average number of yearly fire incidents per 10k residents in Revere, MA compared to nearest cities:
(Note: Based on data for the last 3 years, including only cities with population 5,000 and above)
| Revere: | 68.1 |
| Chelsea: | 76.9 |
| Everett: | 27.9 |
| Malden: | 22.3 |
| Winthrop: | 37.1 |
| Saugus: | 48.2 |
| Melrose: | 6.6 |
| Lynn: | 45.3 |
| Medford: | 41.3 |
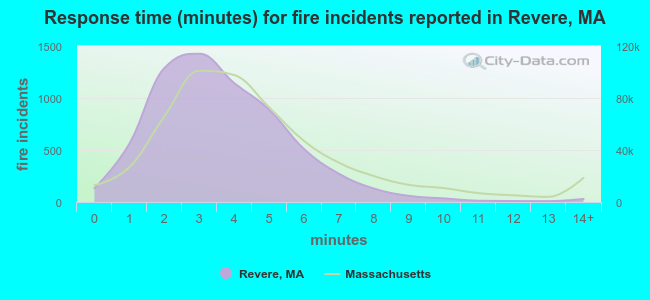 The median response time based on all reported fire incidents is 3 minutes. This is lower compared to the state median value.
The median response time in Revere, MA compared to nearest cities:
(Note: Based on data for all years, including only cities with at least 500 fire incidents)
| Revere: | 3 minutes |
| Chelsea: | 3 minutes |
| Everett: | 2 minutes |
| Malden: | 3 minutes |
| Winthrop: | 3 minutes |
| Saugus: | 5 minutes |
| Lynn: | 4 minutes |
| Medford: | 3 minutes |
| Somerville: | 3 minutes |
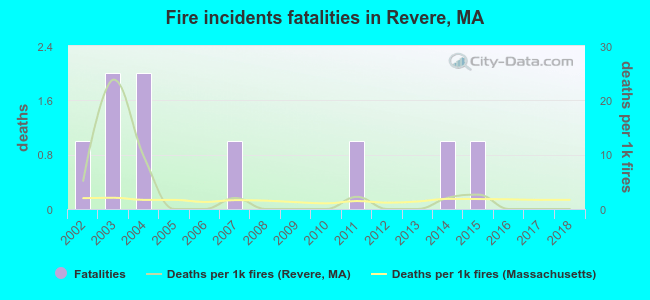 According to the reports from the years 2002 - 2018 the average number of fire-related fatalities per year is 1. The highest number of deaths - 2 took place in 2003, and the lowest - 0 in 2005. The data has a dropping trend.
The average number of deaths per 1,000 fires is 3. This indicator was the highest - 24 in 2003, and the lowest 0 in 2005. The trend for deaths per 1,000 incidents is dropping. Compared to the Massachusetts value the number of deaths per 1,000 incidents is about the same.
According to the reports from the years 2002 - 2018 the average number of fire-related fatalities per year is 1. The highest number of deaths - 2 took place in 2003, and the lowest - 0 in 2005. The data has a dropping trend.
The average number of deaths per 1,000 fires is 3. This indicator was the highest - 24 in 2003, and the lowest 0 in 2005. The trend for deaths per 1,000 incidents is dropping. Compared to the Massachusetts value the number of deaths per 1,000 incidents is about the same.
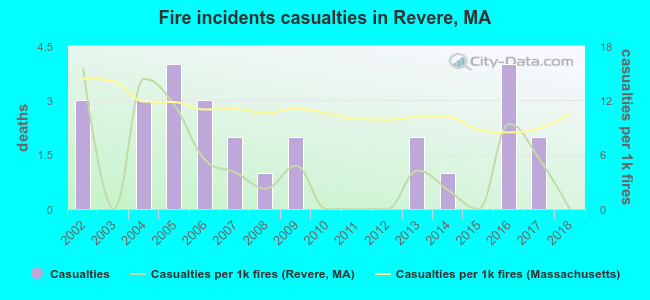 Based on the reports from the years 2002 - 2018 the average number of fire-related yearly casualties is 2. The highest number of injuries - 4 took place in 2005, and the lowest - 0 in 2003. The data has a decreasing trend.
The average number of injuries per 1,000 fires is 5. This indicator was the highest - 16 in 2002, and the lowest 0 in 2003. The trend for casualties per 1,000 fire incidents is declining. Compared to the Massachusetts value the number of casualties per 1,000 fire incidents is much lower.
Based on the reports from the years 2002 - 2018 the average number of fire-related yearly casualties is 2. The highest number of injuries - 4 took place in 2005, and the lowest - 0 in 2003. The data has a decreasing trend.
The average number of injuries per 1,000 fires is 5. This indicator was the highest - 16 in 2002, and the lowest 0 in 2003. The trend for casualties per 1,000 fire incidents is declining. Compared to the Massachusetts value the number of casualties per 1,000 fire incidents is much lower.
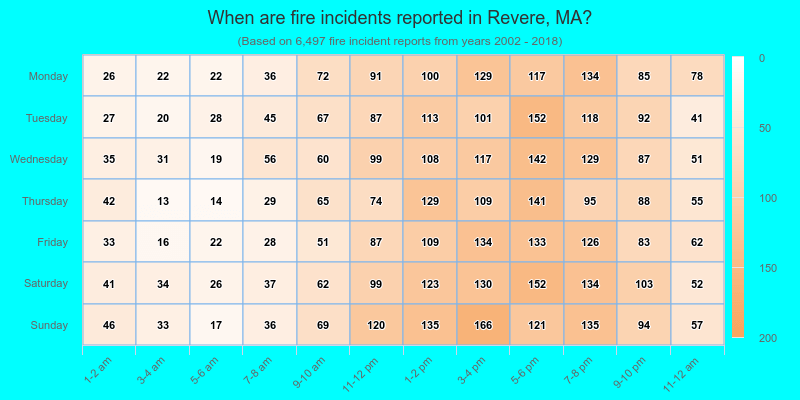
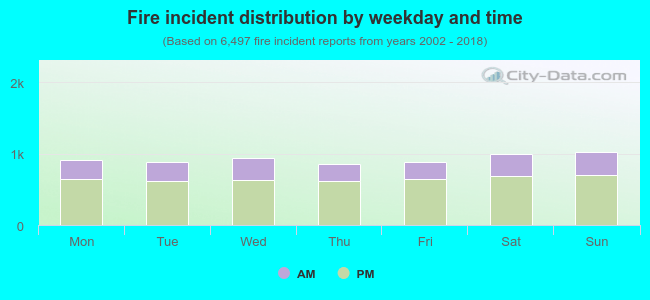 29.8% incidents where reported in the morning and 70.2% in the evening. The most fires (15.8%) took place on Sunday, and the least (13.1%) on Thursday.
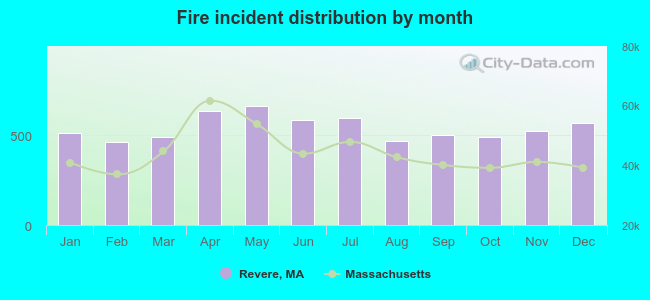 According to the 6,497 fires from years 2002 - 2018 most fires (10.2%) took place during May, and the least (7.1%) in February.
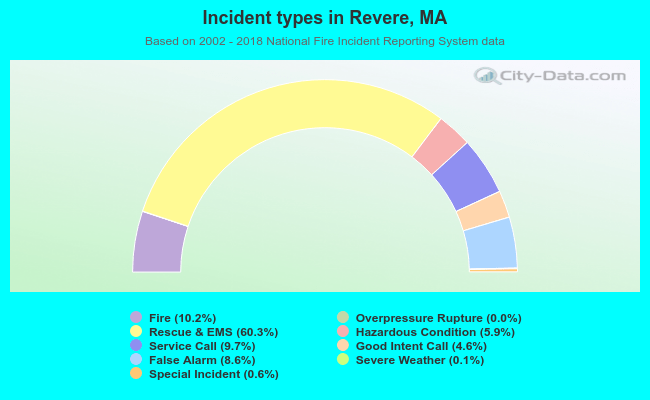 Out of all 63,434 cases reported during the years 2002 - 2018, the most belonged to the categories: Rescue & EMS (60.3%), Fire (10.2%), and Service Call (9.7%).
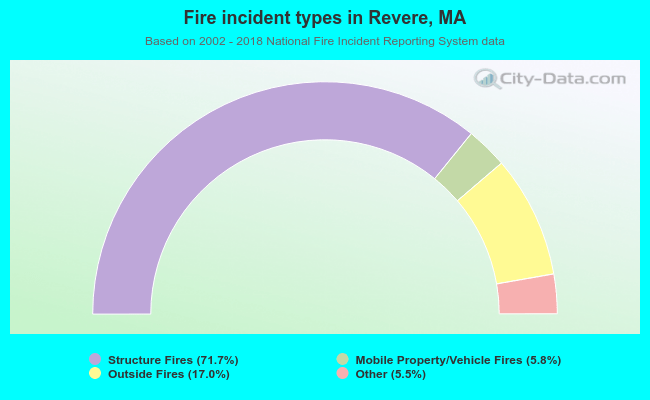 When looking into fire subcategories, the most incidents belonged to: Structure Fires (71.7%), and Outside Fires (17.0%).