Riverside: Fire Incidents, Connecticut (CT)
Where are fire incidents reported in Riverside, CT
Something went wrong! Please refresh the page.
|
| |||||||||||||||||||||||||||||||||||||||||||||||||||||||||||||||||||||||||||||||||||||||||||||||||||||||||||||
2007 - 2018 National Fire Incident Reporting System (NFIRS) incidents
- Incident types reported to NFIRS in Riverside, CT
- 76540.4%False Alarm
- 56529.8%Hazardous Condition
- 1538.1%Service Call
- 1518.0%Fire
- 1125.9%Good Intent Call
- 1085.7%Rescue & EMS
- 261.4%Severe Weather
- 80.4%Overpressure Rupture
- 50.3%Special Incident
- Fire incident types reported to NFIRS in Riverside, CT
- 6341.7%Structure Fires
- 5133.8%Outside Fires
- 2717.9%Mobile Property/Vehicle Fires
- 106.6%Other
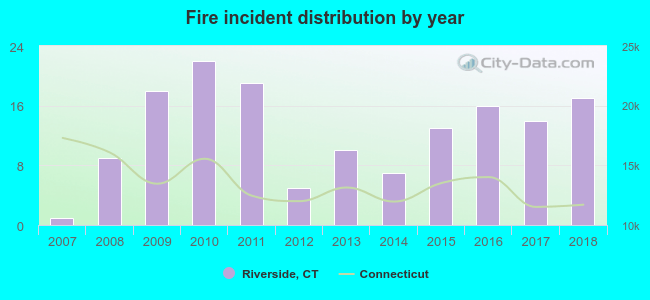 Based on the data from the years 2007 - 2018 the average number of fire incidents per year is 13. The highest number of reported fires - 22 took place in 2010, and the least - 1 in 2007. The data has an increasing trend.
The average number of yearly fire incidents per 10k residents in Riverside, CT compared to nearest cities:
(Note: Based on data for the last 3 years, including only cities with population 5,000 and above)
| Riverside: | 18.6 |
| Oxford: | 26.3 |
| Monroe: | 45.5 |
| Seymour: | 29.4 |
| Ansonia: | 49.2 |
| Shelton: | 16.1 |
| Derby: | 47.0 |
| Southbury: | 30.6 |
| Beacon Falls: | 40.8 |
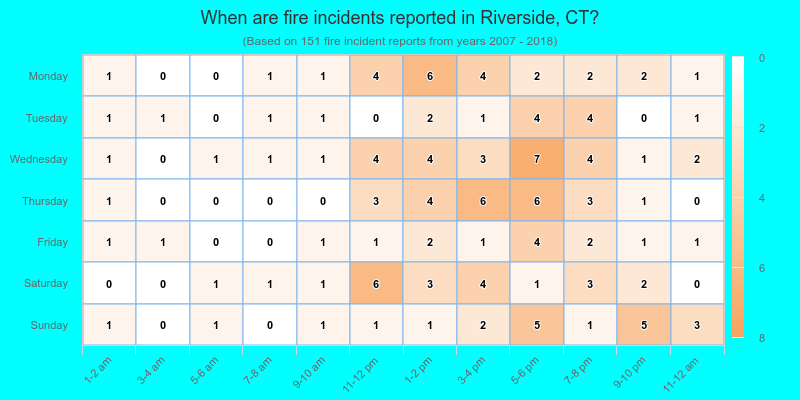
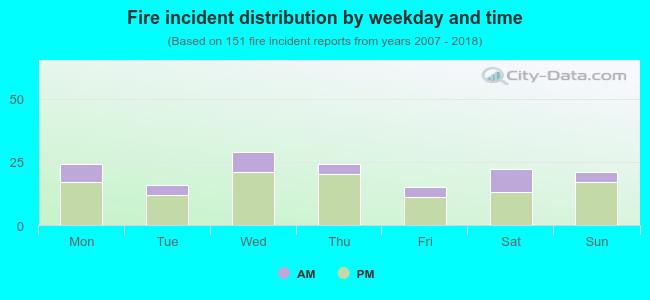 26.5% incidents where reported in the morning and 73.5% in the evening. The most fires (19.2%) took place on Wednesday, and the least (9.9%) on Friday.
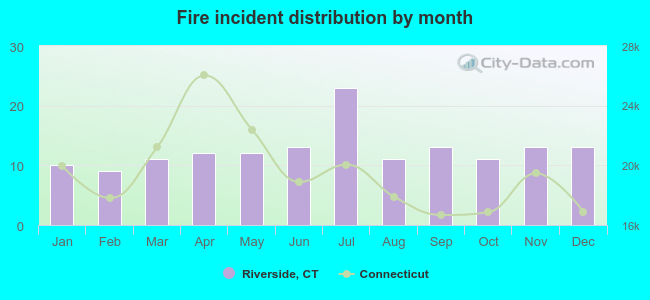 According to the 151 incident reports from years 2007 - 2018 most fires (15.2%) took place during July, and the least (6.0%) in February.
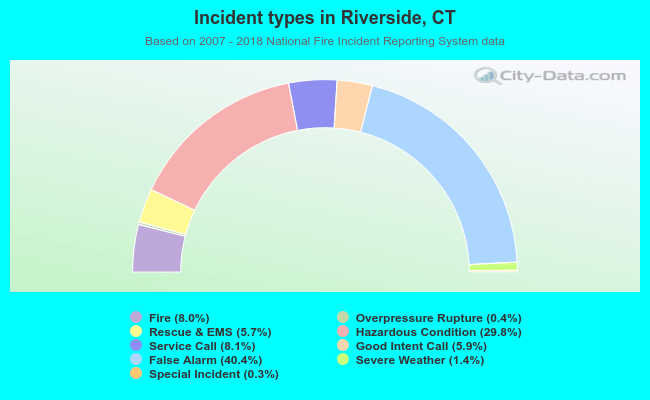 Out of all 1,893 cases reported during the years 2007 - 2018, the most belonged to the categories: False Alarm (40.4%), Hazardous Condition (29.8%), and Service Call (8.1%).
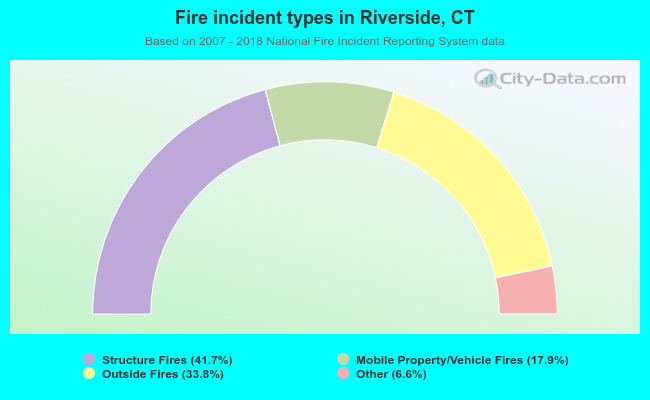 When looking into fire subcategories, the most reports belonged to: Structure Fires (41.7%), and Outside Fires (33.8%).