Riverton: Fire Incidents, Wyoming (WY)
Where are fire incidents reported in Riverton, WY
Something went wrong! Please refresh the page.
|
| |||||||||||||||||||||||||||||||||||||||||||||||||||||||||||||||||||||||||||||||||||||||||||||||||||||||||||||
| Other | 102 | |||||||||||||||||||||||||||||||||||||||||||||||||||||||||||||||||||||||||||||||||||||||||||||||||||||||||||||
2002 - 2018 National Fire Incident Reporting System (NFIRS) incidents
- Incident types reported to NFIRS in Riverton, WY
- 1,45657.4%Fire
- 34213.5%Hazardous Condition
- 26310.4%Good Intent Call
- 2088.2%False Alarm
- 1897.4%Rescue & EMS
- 552.2%Service Call
- 140.6%Special Incident
- 60.2%Overpressure Rupture
- 40.2%Severe Weather
- Fire incident types reported to NFIRS in Riverton, WY
- 82856.9%Outside Fires
- 31221.4%Structure Fires
- 20013.7%Mobile Property/Vehicle Fires
- 1168.0%Other
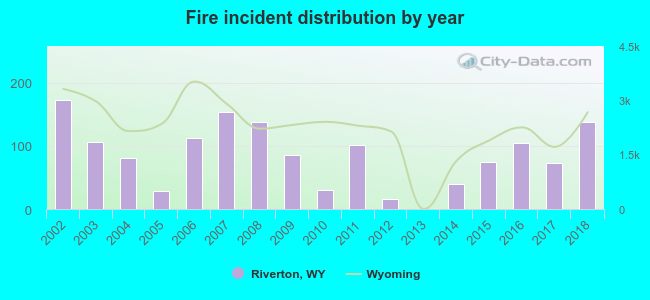 According to the data from the years 2002 - 2018 the average number of fires per year is 86. The highest number of reported fires - 172 took place in 2002, and the least - 0 in 2013. The data has a decreasing trend.
The average number of yearly fire incidents per 10k residents in Riverton, WY compared to nearest cities:
(Note: Based on data for the last 3 years, including only cities with population 5,000 and above)
| Riverton: | 96.2 |
| Lander: | 61.9 |
| Worland: | 46.0 |
| Rawlins: | 53.5 |
| Casper: | 18.4 |
| Rock Springs: | 39.8 |
| Green River: | 27.7 |
| Jackson: | 14.4 |
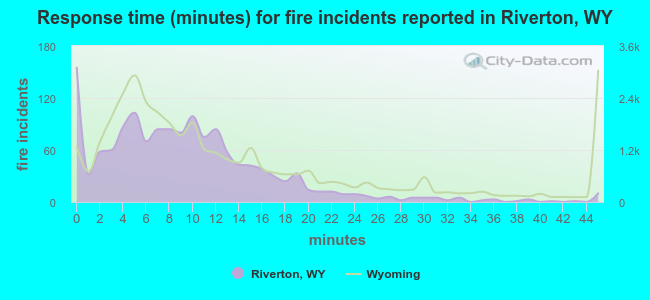 The median response time based on all reported fire incidents is 8 minutes. This is lower than the state median value.
The median response time in Riverton, WY compared to nearest cities:
(Note: Based on data for all years, including only cities with at least 500 fire incidents)
| Riverton: | 8 minutes |
| Lander: | 8 minutes |
| Thermopolis: | 11 minutes |
| Worland: | 5 minutes |
| Rawlins: | 7 minutes |
| Casper: | 6 minutes |
| Rock Springs: | 6 minutes |
| Green River: | 7 minutes |
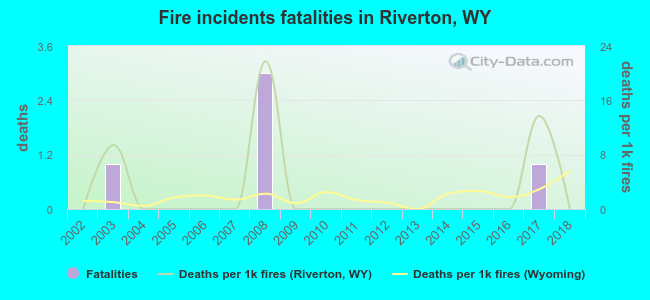 According to the data from the years 2002 - 2018 the average number of fire-related fatalities per year is 0. The highest number of reported deaths - 3 took place in 2008, and the lowest - 0 in 2002. The data has a constant trend.
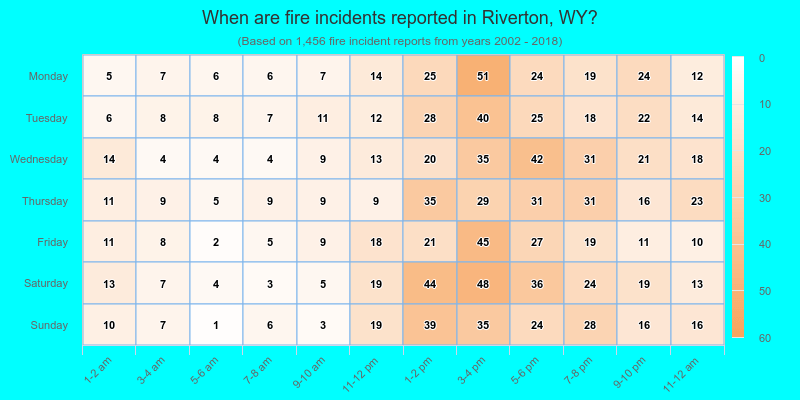
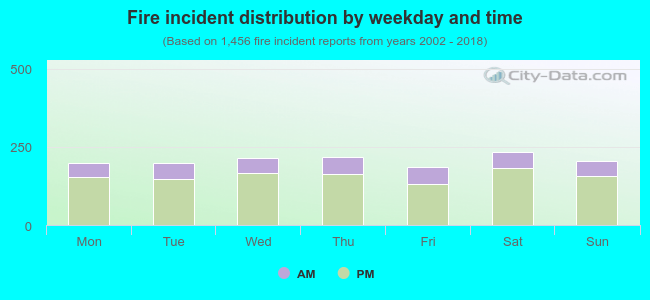 23.8% incidents where reported in the morning and 76.2% in the evening. The most fires (16.1%) took place on Saturday, and the least (12.8%) on Friday.
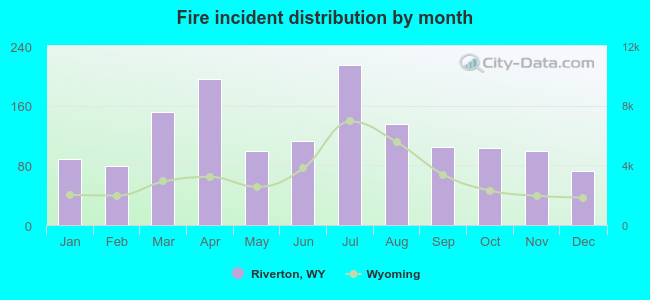 Based on the 1,456 fires from years 2002 - 2018 most fires (14.7%) took place during July, and the least (5.0%) in December.
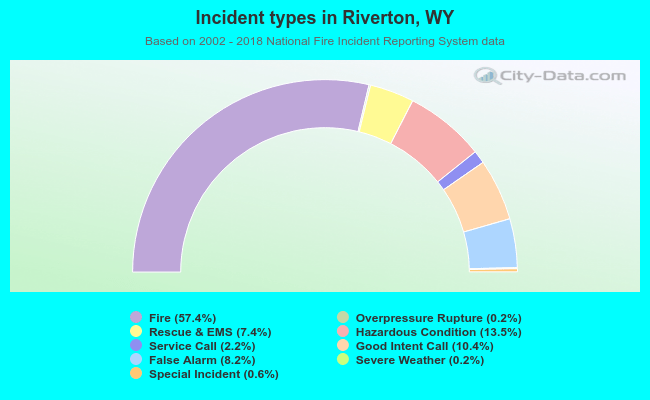 Out of all 2,537 cases reported during the years 2002 - 2018, the most belonged to the categories: Fire (57.4%), Hazardous Condition (13.5%), and Good Intent Call (10.4%).
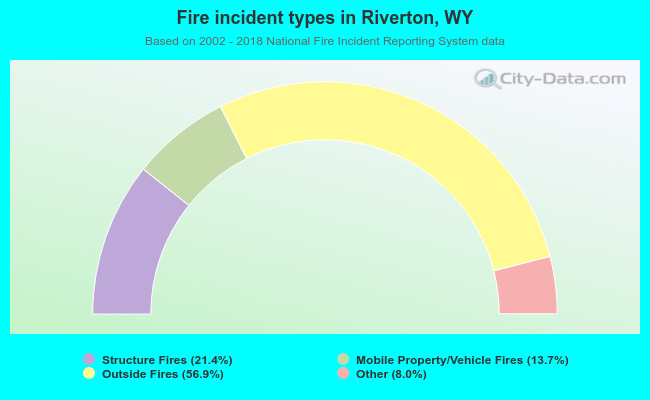 When looking into fire subcategories, the most reports belonged to: Outside Fires (56.9%), and Structure Fires (21.4%).