Rockland: Fire Incidents, Massachusetts (MA)
Where are fire incidents reported in Rockland, MA
Something went wrong! Please refresh the page.
| Fire incidents reported | |
|---|---|
| Sreet name | Count |
| UNION ST | 108 |
| MARKET ST | 78 |
| HINGHAM ST | 68 |
| MARKET ST. | 68 |
| UNION ST. | 58 |
| UNION ST | 42 |
| EAST WATER ST | 40 |
| WEBSTER ST | 38 |
| BEECH ST. | 30 |
| HINGHAM ST. | 28 |
| MARKET ST | 28 |
| HINGHAM ST | 24 |
| WEBSTER ST. | 24 |
| SUMMER ST | 22 |
| GROVE ST | 20 |
| NORTH AVE | 20 |
| PLAIN ST | 20 |
| CENTRE AVE | 18 |
| GROVE ST | 16 |
| LIBERTY ST | 16 |
| MARTHA DR | 16 |
| CENTRE AVE. | 14 |
| HANNAH WAY | 14 |
| SPRING ST | 14 |
| W.WATER ST. | 14 |
| WEBSTER ST | 14 |
| LIBERTY ST | 12 |
| NORTH AVE. | 12 |
| NORTHBOUND RT3 | 12 |
| CHURCH ST | 10 |
| Other | 67 |
2002 - 2018 National Fire Incident Reporting System (NFIRS) incidents
- Incident types reported to NFIRS in Rockland, MA
- 10,81265.7%Rescue & EMS
- 1,91411.6%Hazardous Condition
- 1,3168.0%False Alarm
- 9655.9%Fire
- 8615.2%Service Call
- 5513.3%Good Intent Call
- 210.1%Special Incident
- Fire incident types reported to NFIRS in Rockland, MA
- 44746.3%Structure Fires
- 33434.6%Outside Fires
- 11211.6%Mobile Property/Vehicle Fires
- 727.5%Other
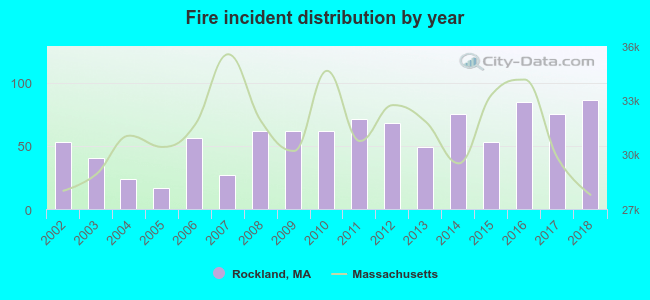 Based on the data from the years 2002 - 2018 the average number of fires per year is 57. The highest number of fires - 86 took place in 2018, and the least - 17 in 2005. The data has a rising trend.
The average number of yearly fire incidents per 10k residents in Rockland, MA compared to nearest cities:
(Note: Based on data for the last 3 years, including only cities with population 5,000 and above)
| Rockland: | 46.9 |
| Abington: | 34.0 |
| Hanover: | 38.7 |
| Whitman: | 19.8 |
| Norwell: | 40.0 |
| Holbrook: | 47.3 |
| Weymouth: | 50.1 |
| Brockton: | 60.2 |
| Pembroke: | 3.6 |
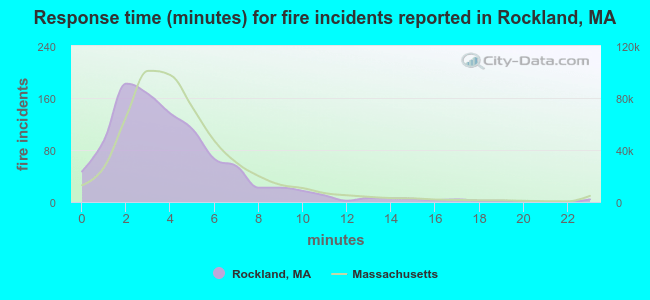 The median response time based on all reported fire incidents is 3 minutes. This is lower compared to the Massachusetts median value.
The median response time in Rockland, MA compared to nearest cities:
(Note: Based on data for all years, including only cities with at least 500 fire incidents)
| Rockland: | 3 minutes |
| Abington: | 4 minutes |
| Hanover: | 5 minutes |
| Whitman: | 2 minutes |
| Norwell: | 5 minutes |
| Holbrook: | 3 minutes |
| Hanson: | 5 minutes |
| Weymouth: | 4 minutes |
| Brockton: | 4 minutes |
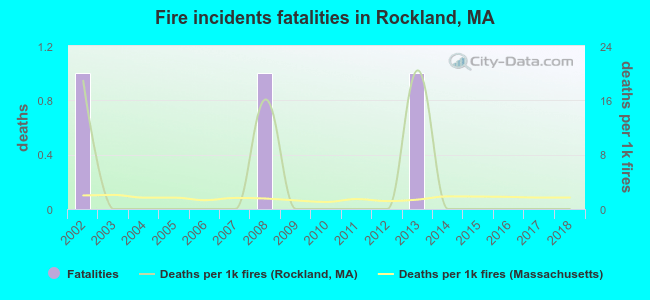 According to the reports from the years 2002 - 2018 the average number of fire-related yearly deaths is 0. The highest number of reported deaths - 1 took place in 2002, and the lowest - 0 in 2003. The data has a decreasing trend.
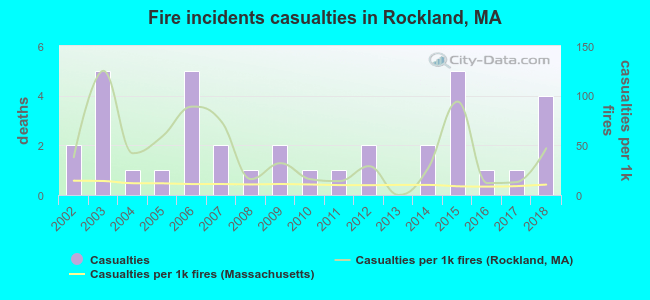 Based on the reports from the years 2002 - 2018 the average number of fire-related casualties per year is 2. The highest number of casualties - 5 took place in 2003, and the lowest - 0 in 2013. The data has a rising trend.
The average number of casualties per 1,000 fires is 43. This indicator was the highest - 125 in 2003, and the lowest 0 in 2013. The trend for casualties per 1,000 incidents is growing. Compared to the state value the number of injuries per 1,000 incidents is much higher.
Based on the reports from the years 2002 - 2018 the average number of fire-related casualties per year is 2. The highest number of casualties - 5 took place in 2003, and the lowest - 0 in 2013. The data has a rising trend.
The average number of casualties per 1,000 fires is 43. This indicator was the highest - 125 in 2003, and the lowest 0 in 2013. The trend for casualties per 1,000 incidents is growing. Compared to the state value the number of injuries per 1,000 incidents is much higher.
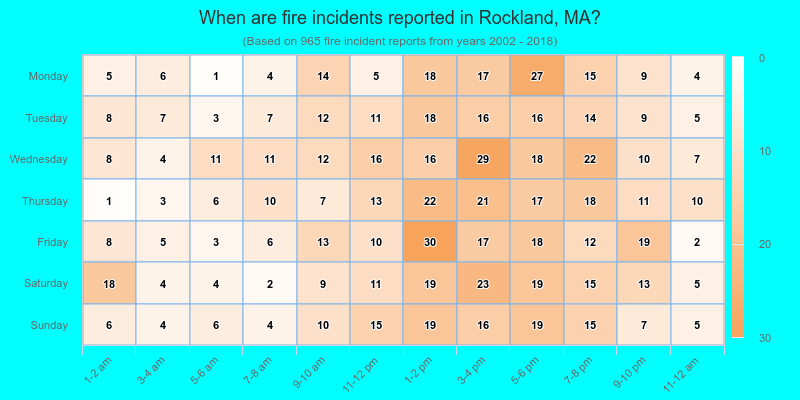
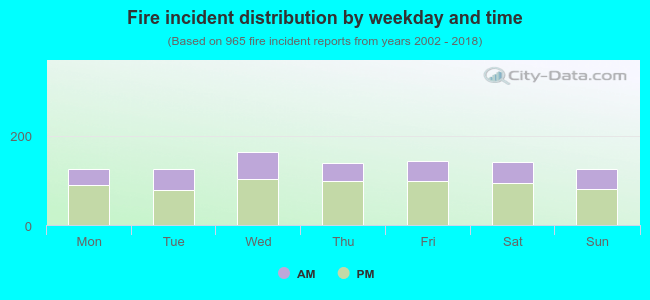 33.5% incidents where reported in the morning and 66.5% in the evening. The most fires (17.0%) took place on Wednesday, and the least (13.0%) on Monday.
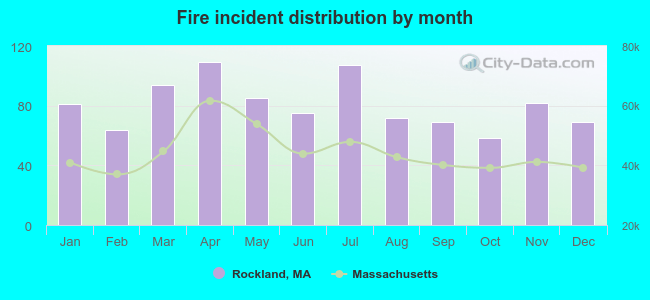 Based on the 965 fire incidents from years 2002 - 2018 most fires (11.3%) took place during April, and the least (6.0%) in October.
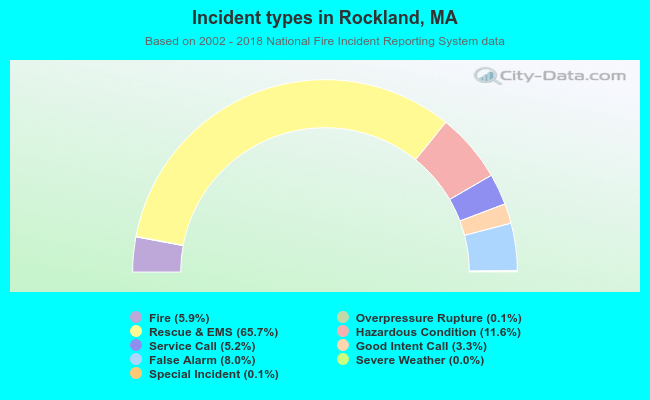 Out of all 16,457 cases reported during the years 2002 - 2018, the most belonged to the categories: Rescue & EMS (65.7%), Hazardous Condition (11.6%), and False Alarm (8.0%).
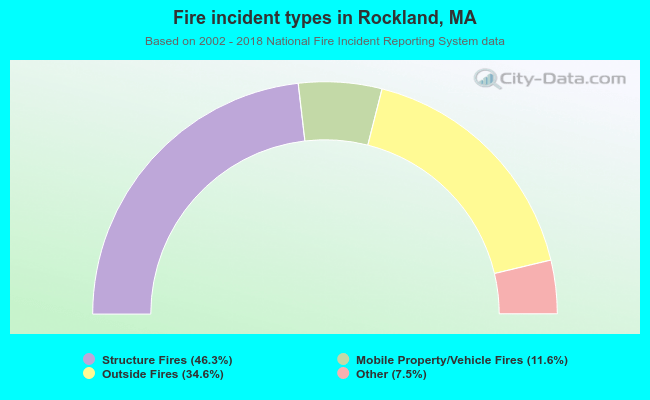 When looking into fire subcategories, the most incidents belonged to: Structure Fires (46.3%), and Outside Fires (34.6%).